
This article is intended as a final conclusion for our series on the absolute valuation approach for cryptocurrencies. In doing so, we will also address the criticism of the equation of exchange model and compare the on- and off-chain speed of different cryptocurrencies.
The theory of velocity presented in the equation of exchange model that is commonly applied to crypto assets would question the business model of utility coins and payment coins that have no incentives to hoard via staking and are expected to have a high velocity as people spend the coins frequently. In support of this theory and Buterin and Samani’s analysis, Coin Metrics’ State of the Network #37 showed how Bitcoin’s on-chain velocity has been steadily decreasing and the price has been going up.
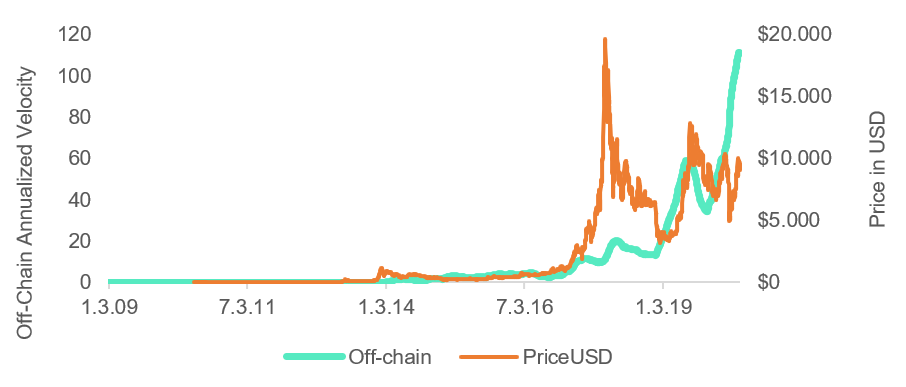
However, we also calculated Bitcoin’s off-chain transaction velocity and found the opposite pattern. We found that Bitcoin’s price and Bitcoin’s exchange activity both went up at the same time over the past few years. On-chain velocity is the velocity generated solely by transactions on the blockchain, whereas off-chain velocity is the velocity generated by trading activities on cryptocurrency exchanges.
Figure 1: Bitcoin’s Off-Chain Velocity is Positively Correlated with Bitcoin Price
We wanted to check these results with other coins, so we calculated on-chain and off-chain velocity for Ethereum, Bitcoin Cash, Litecoin, and Stellar in order to see if coins were trading hands more frequently on-chain (inter-exchange and off-exchange) or off-chain (intra-exchange).
Figure 2: 90-Day Moving Average Bitcoin On-Chain and Off-Chain Velocity
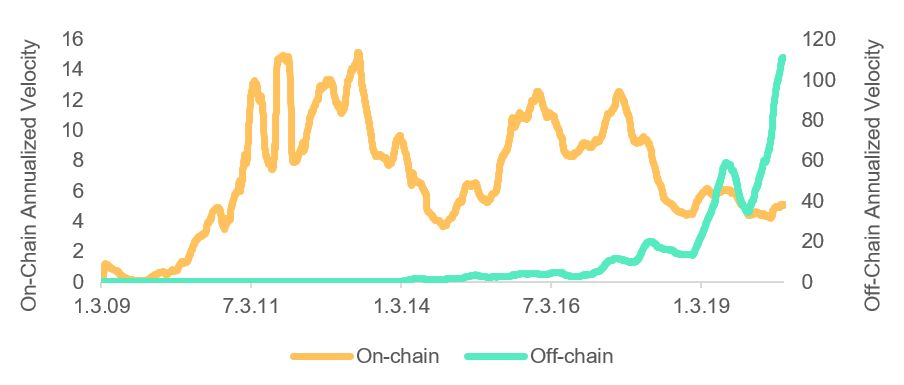
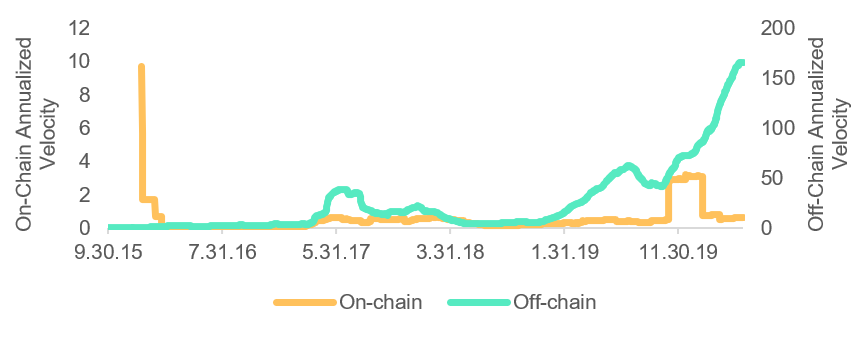
We found that for almost all coins, on-chain velocity is decreasing, while off-chain velocity is increasing. We interpret this to mean that growth in the number of speculative transactions on exchanges is faster than growth of utility transactions to buy goods and services.
Figure 3: 90-Day Moving Average Ethereum On-Chain and Off-Chain Velocity
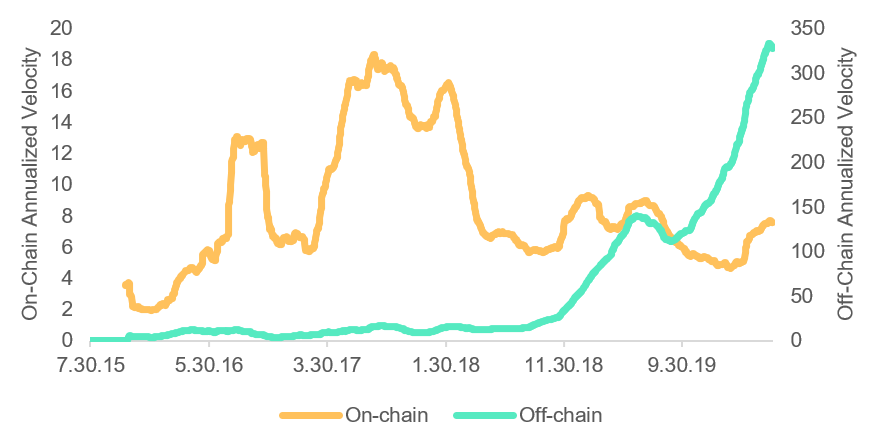
Figure 4: 90-Day Moving Average Bitcoin Cash On-Chain and Off-Chain Velocity
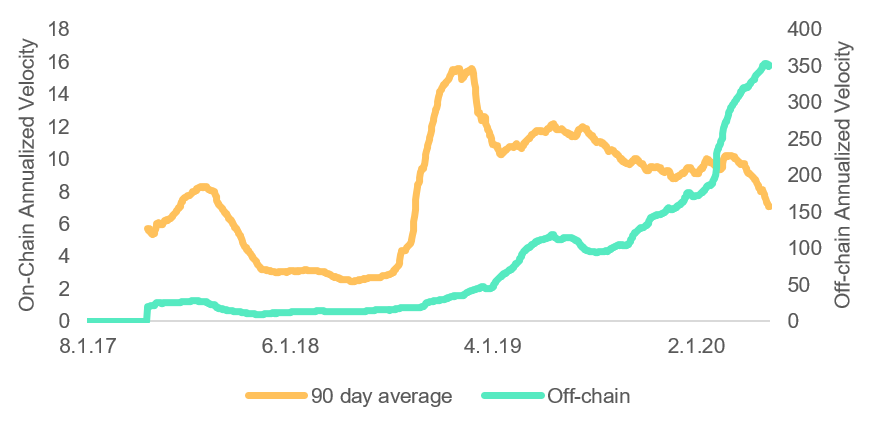
Figure 5: 90-Day Moving Average Litecoin On-Chain and Off-Chain Velocity
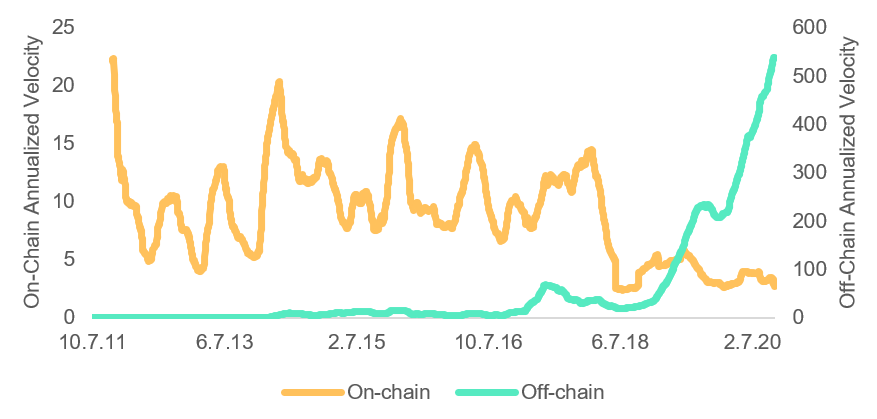
Figure 6: 90-Day Moving Average Stellar On-Chain and Off-Chain Velocity
It is interesting to observe similar trends in velocity among almost all of the cryptocurrencies. Higher velocities before the cryptocurrency matures and more stable and lower velocities later on. Stellar seems to be an exception to this rule (mainly looking at the huge jump in velocity late 2019), but as we know, Stellar’s Coinbase is heavily centralized and it is likely that this is a foundation transaction distorting the numbers.
It is also worth noting the huge jump in off-chain velocities among all cryptocurrencies in 2019-2020 coinciding with the drop in on-chain velocity. This suggests that traders who operate exclusively on exchanges and trade with high volumes are becoming the dominant force in the crypto asset market instead of long-term holders.
The results that we found do contradict Buterin and Samani’s theory because we found that velocity is increasing and the price is going up, even though their model says the price should be going down. Scott Locklin’s critic of their work may hold the answer. As Locklin points out, applying Fisher’s MV = PT equation of exchange directly to crypto assets doesn’t work because of two main reasons:
“The inverse of (average) token velocity is not average holding time. For example, let us postulate a money supply of 10 tokens in an economy with a velocity of 10 times per day. If 9 of the tokens are traded once every 1000 days, and one of the tokens 99.991 times a day, this gives mean token velocity 10 times per day. However, the average holding time for a coin in this ecosystem is 900.001 days, not 1/10 day per transaction.”
“Similarly, while Fisher’s equation of exchange is an equilibrium model (which I suppose could be called “steady state”), it does not depend on the number of users.”
Locklin does a few transformations to the equation and argues that user adoption really does matter for the price of a coin. As more people come to the network and demand the coin, the price goes up. Locklin’s critique is straight forward. If more people demand Bitcoin and Ethereum for buying coffees or for speculating, the result is similar. Either way, people are trading economic resources for cryptocurrencies and bidding up their prices. In defense of Buterin and Samani, speculation on financial assets is normally left out of GDP metrics. Foreign exchange volume isn’t included in GDP, for example, and therefore, analyzing the velocity of crypto asset speculation may not be appropriate.
Final Word
Vitalik’s token economic concepts of velocity and velocity sinks that encourage hoarding are important; however, the analysis is static and doesn’t consider new user adoption and growing demand. If cryptocurrencies gain adoption for long-term hoarding purposes or for short-term spending on speculation or coffees, the price of crypto assets will go up. High velocity on-chain and low velocity off-chain suggests that crypto assets are becoming increasingly used for speculation and not for store of value.