
The list of addressable target markets for cryptocurrencies is very long, but what is the current adoption level and what growth can we expect in the coming years? Although this question cannot be answered unambiguously, there is a certain spectrum of realistic possibilities, defined by pessimistic and optimistic limits.
Once the M, V, P, and Q are estimated, the penetration rate of each TAM by each cryptocurrency is calculated. This is called the adoption rate, and this is based on an assumption regarding future use of the currency for each use case. To estimate adoption, there are two mains methods: first, estimating the growth in the number of people owning crypto per year and, second, fitting a curve to the historical growth in active wallet addresses.
Forecasting Adoption with Historical Data on the Growth in the Number of People Using Crypto Worldwide
Approximately 40+ million cryptocurrency users exist globally according to our research. The number of registered accounts on the biggest crypto exchanges serve as a usable proxy. Coinbase for example has more than 30 million users (CoinTelegraph). Binance founder Changpeng Zhao (CZ) recently said in an interview that they have about 12 to 15 million registered users and about 0.5 to 2 million daily active users. There are several other similarly big exchanges, like Kraken, Bitstamp, Bitfinex, Bittrex, Huobi, and OKEx. Assuming that Coinbase has the most users, there must be at least 30 million cryptocurrency users. Binance and Coinbase together have about 45 million users. This averages to 22.5 million users per exchange. For the eight biggest exchanges, a number of 180 million (22.5 x 8) users would come up. Adding the assumption that most users are registered on several exchanges, this number seems to be too big. The correct answer probably lies between 35 to 70 million users.
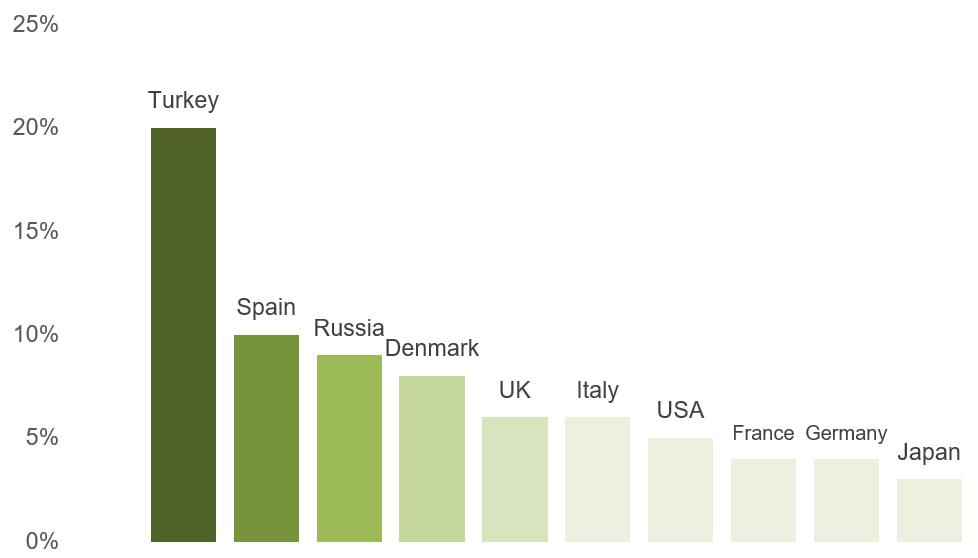
Having a look at different surveys, about 5–8% of US-American adults own cryptocurrencies (Statista Global Consumer Survey, Finder.com). There are countries like Turkey which have more users and countries like Japan that have fewer. Also, according to the survey, Spain has a higher level of cryptocurrency users when compared to other western European countries. In Spain, 10% of adults own cryptocurrencies.
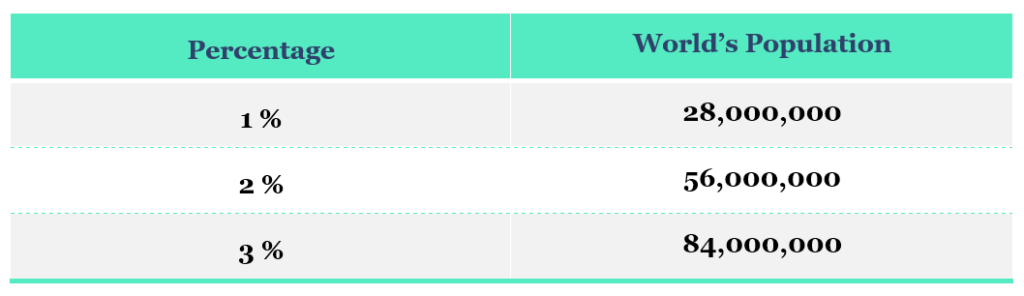
A final estimate of the total number of users could be done with the following experiment. There are about 4.3 billion people with access to internet, therefore being possible crypto owners. Let’s subtract 1.5 billion because of legislative restriction (i. e. China, Pakistan, and others). The following table shows the number of potential cryptocurrency users depending on the world’s population.
Table 1: Estimating the World’s Population of Crypto Users
According to the CEO of Binance, CZ, the number of accounts from a country on Binance correlates positively with the GDP per capita (high GDP – more accounts).
Figure 1: Percentage of Cryptocurrency Users per Country
Forecasting Adoption with Historical Data on the Growth in the Active Addresses
Another approach is to count the number of wallets. According to BitInfoCharts, there are currently more than 43 million Bitcoin addresses. If we use this as a proxy and take Bitcoin dominance into consideration, which is currently at 67 % (CoinMarketCap), we can assume that there must be about 64 million addresses 43 / 0.67) for Bitcoin and all Altcoins. Some users may have both, bitcoins and altcoins; therefore, there may be roughly about 37 to 52 million cryptocurrency users.
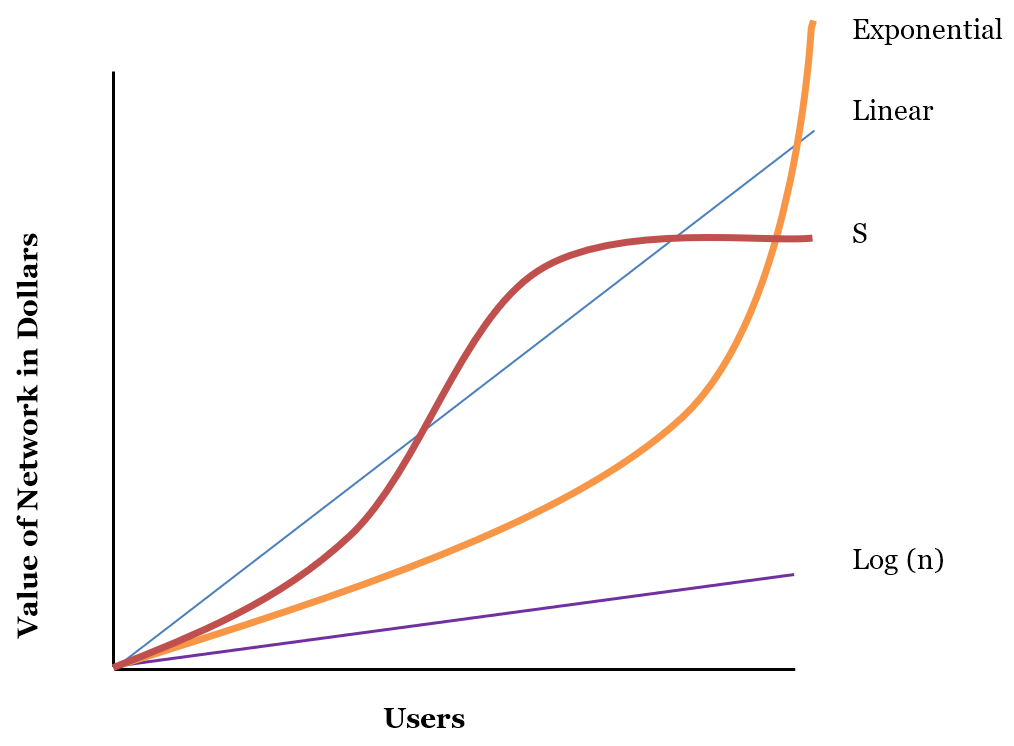
Most studies adopt an S-curve beginning on when the network is launched. There are several different possible curves for cryptocurrency adoption, such as S-curve and linear. Other curve options include exponential and log. All of the following curve assumptions can be seen on the following graph.
Figure 2: Adoption Curves for Network Use
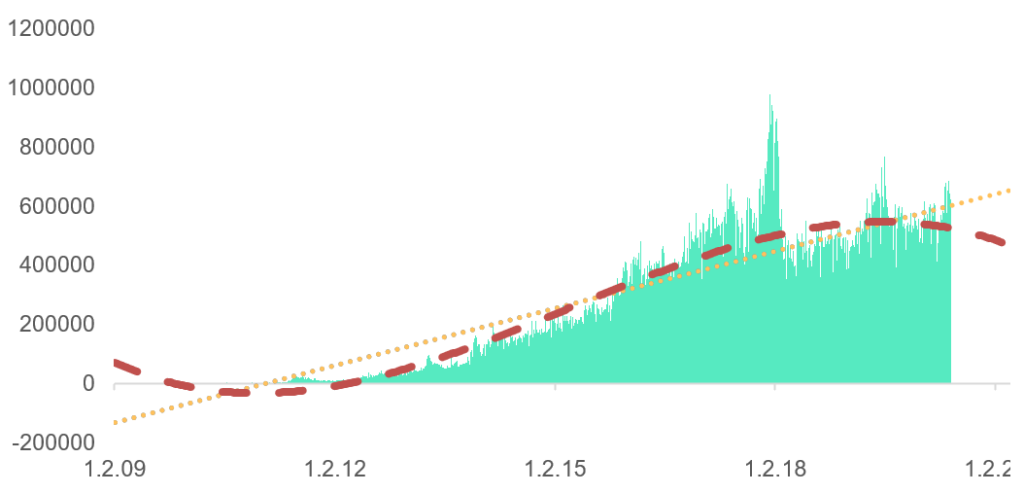
After fitting the daily data of wallet use with a non-zero balance, use of Bitcoin as a medium of exchange appears to be following a linear curve or an S-curve and currently has approximately 600,000 active users per day.
Figure 3: Bitcoin’s Adoption Curve is Assumed to be an S-Curve
From behavioral economics, many variables impact adoption, such as path dependency, network effects, superior technology, market salience, and ambiguity aversion held by investors and users. Adoption is difficult to measure because once a metric becomes standardized, cryptocurrency developers and investors try to game that metric or trick that metric in order to manipulate the market.
Scenarios
To improve the robustness of the adoption rate analysis, several scenarios can be calculated for the adoption rate of each cryptocurrency for their respective TAMs. This report assumes three different scenarios:
- Bearish
- a. Cryptocurrency will only takeover 1 % of the entire target addressable market.
- b. The cryptocurrency will take two years to achieve 10 % of the 1 % adoption.
- c. The number of years that the cryptocurrency will take to achieve 90 % of the 1 % adoption will be seven.
- Modest
- a. Cryptocurrency will only takeover 10 % of the entire target addressable market.
- b. The cryptocurrency will take two years to achieve 10 % of the 1 % adoption.
- c. The number of years that the cryptocurrency will take to achieve 90 % of the 1 % adoption will be five.
- Bullish
- a. Cryptocurrency will only takeover 20 % of the entire target addressable market.
- b. The cryptocurrency will take two years to achieve 20 % of the 1 % adoption.
- c. The number of years that the cryptocurrency will take to achieve 90 % of the 1 % adoption will be five.
Discount Rate
A dollar today is worth more than a dollar a year from now. Stock valuation models, such as the discounted cash flow model, can use discounts rates of 10–50% per year based on the risk of the industry and the company. Take the future current value and discount it back to the present. Taking the value of $7.45 and discounting it back 10 years at a rate of 40% yields a rational market value of $0.26. The calculation is $7.45 / (1.40¹⁰). An alternative approach is to discount each period utility value and use the weighted average by applying larger weights to periods that are closer. The Satis Report argues that discounting isn’t required for the TAM analysis; however, most reports incorporate a discount rate. Chris Burniske uses rates between 30% and 40%. The 2015 Wedbush Securities report uses a discount rate of 40%. In this report, we apply 30%; however, additional research on the property discount rate of each coin to reflect distinct risk profiles is needed.
Winner Takes All
Since this analysis is investigating five coins instead of just one, an additional assumption is required.
Many of the coins in the top five are competing with each other to become global ledgers for storing and trading digital assets. Therefore, one assumption to make is whether or not there will be a winner take all or an oligopoly of cryptoassets for each main use case. Several studies assume each protocol is an isolated economy to simplify calculations. However, the cryptocurrency market is one of the most competitive markets in the world. The cryptocurrency market has less regulatory barriers to entry and switching costs between cryptocurrencies are low. This assumption is relevant for adoption rate, scenario probability, and discount rate.
One could argue that the winning protocols of these digital resources will become global standards, and global standards are typically “winner takes most” scenarios. Therefore, this report makes the following assumptions:
- Bitcoin will beat Ethereum, Bitcoin Cash, and Litecoin in the currency coin group.
- This is reflected in the “discount rate”. Bitcoin is assumed to have a discount rate of 30%, while Bitcoin Cash and Litecoin are assumed to have a discount rate of 50%.
- Ethereum will beat Stellar in the utility coin group.
- This is reflected in the “discount rate.” Ethereum is assumed to have a discount rate of 30%. Stellar is assumed to have a discount rate of 50%.
These assumptions are based on current technology and regulatory strengths that Bitcoin and Ethereum have. The hash rate dedicated to Bitcoin is magnitudes larger than any other cryptocurrency. Finally, Bitcoin’s decentralized nature has prompted SEC officials to unofficially consider Bitcoin to not be a security. This provides some regulatory protection for Bitcoin that may hinder new blockchain start-ups. However, Bitcoin Cash and Litecoin also have advantages. Both coins offer faster confirmation times and lower transaction fees compared to Bitcoin, and they are sufficiently decentralized with large networks of investors and Bitcoin Cash has many developers working on protocol upgrades. Instead of a winner-takes-all during the next ten years, an oligopoly of payment coins is likely to remain in place. Plus, several investors use naïve 1/n strategies to invest in cryptocurrencies and, therefore, invest equally in the top currency coins in order to reduce risk and capture the market.
Valuation Results
Looking into all the variables and addressable markets, we have come up with a utility price estimate for each of the examined cryptocurrencies. It is worth nothing that each of those estimates is done on a non-discounted basis and with either bearish or moderate market penetration assumptions.
Table 2: Equation of Exchange Forecast of Crypto Asset Prices
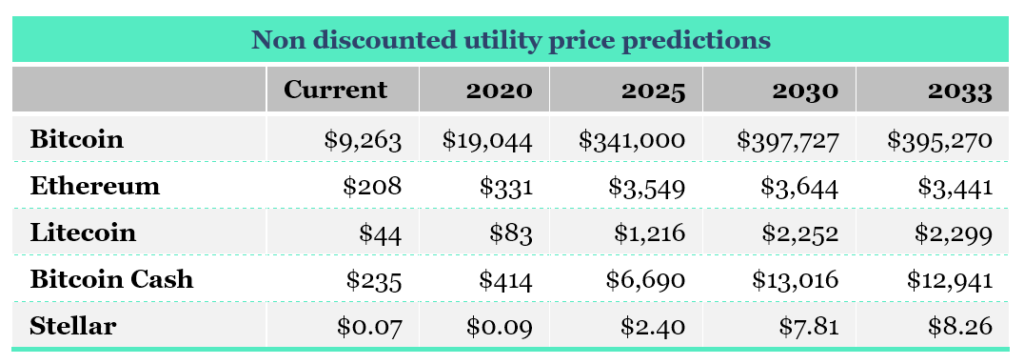
It is worth noting that, as of the time of writing this report, the total crypto market cap (all currencies, not just the 5 listed above) sits at $256 billion. In the meantime, the TAM of all the potential markets as discussed above, is in excess of $188 trillion, which makes the current crypto penetration across those markets 0.136%.
As seen by the charts above, we believe that Bitcoin is still at the very start of its adoption curve. The price of $7,200 at the end of 2019 suggests that Bitcoin has penetrated less than 0.44% of its total addressable markets. If this penetration manages to reach 10%, its non-discounted utility price should reach nearly $400,000.
After we have now analysed and defined the most important variables and terms related to the absolute valuation approach, we are able to make a final conclusion in next week’s article. There we will also discuss whether the approach provides a sufficient explanation for the price development in recent years, or whether Buterin and Samani were right after all.