
In last weeks article we took a first look at the absolute valuation approach for crypto assets. The core question is whether a high off-chain speed endangers the stability of the market, as claimed by Vitalik Buterin, for example. In order to get closer to an answer, we will explore the topic by taking a closer look at the central concepts of money supply, velocity and the addressable target market.
Monetary Supply
The (M) in MV = PQ is measured by the supply in circulation of a crypto asset. (M) is the monetary base necessary to support an economy. The supply of some cryptocurrencies is easy to estimate if their supply follows predetermined processes (Bitcoin and Poisson, etc.). Supply is coming from two main areas: new coins released into circulation either through mining, staking, or reserve sales and coins being sold on the market from wallets. The goal of “M” is to estimate the amount of coins that are in each year’s circulation and will be available on the market. Often referred to as the float. The float is comprised of two parts: flow and stock. The flow is the amount of the cryptoasset that will be issued each year, and the stock is how much has already been issued.
This report assumes a stable supply of each cryptoasset for each year and forecasts the supply over the decade based on each cryptoasset’s programmed supply schedule in its protocol. However, a more in-depth analysis would try to forecast future circulating supply by calculating the float or circulating supply of each cryptocurrency. To calculate the float, “hodled” assets or assets that are hoarded must be subtracted. For example, if 100 million coins are issued and 60 % are hoarded in wallets that never move, M is equal to 40 million coins. This applied to Coinbase users who purchased Bitcoin in 2016. 57 % of Coinbase users held their bitcoin in 2016 as a store of value and speculative asset instead of using it as a medium of exchange.
Velocity
(V) is the velocity of each unit of money in the monetary base. If Alice passes a bitcoin to Bob once a year, that’s an annual velocity of 1. If Bob passes on that same bitcoin to Eve, that’s an annual velocity of 2. The value of a coin is inversely proportional to the total discounted supply and inversely proportional to velocity. Thus, a currency which increases its velocity will lose value with respect to any other currency whose velocity doesn’t increase that much.
Velocity is a key variable where many reports diverge. Vision &’s estimate of velocity was 10. To put this into perspective, the US M1 money supply has a velocity of approximately 5. What pulls down velocity is friction. Since cryptoassets are natively digital, their friction will be lower than physical cash, which will place an upward pressure on velocity compared to physical currencies. On the other hand, physical fiat currencies have high inflation rates, which promote high velocity. Cryptocurrencies with low inflation rates and purchasing power appreciation will have a downward pressure on velocity.
This report assumes a stable velocity of each coin over the next decade. The velocity figure is calculated based on the 2019 on-chain velocity of each coin. Velocity is calculated by dividing the annual trading volume in dollars by the network’s on chain transaction volume and then taking an annual average for 2019. A more in-depth analysis would try to forecast the average amount of hoarded assets each coin will have each year. Hoarded cryptoassets pull down each coin’s average yearly velocity because they have a velocity of zero. As previously mentioned, the 57% of Coinbase users who held their Bitcoin in 2016 had a velocity of zero. Coins that incorporate staking such as Dash also need to have their velocity adjusted because staked coins have a velocity of zero.
Target Addressable Market
- (P) is the average price of goods in the economy. With regards to currency, utility, and stable coins, the price is the cost of the good or service being provisioned.
- (Q) is the quantity of goods in the economy.
The total global demand for cryptoassets, (PQ), is calculated by determining the size of each target addressable market (TAM) for each coin for each year and what percentage of the TAM will be penetrated by the coin each year.
However, not all use cases can be served by all coins. So, first we have to distinguish between four types of coins:
- A store of value coin is defined as a distributed ledger technology that can be used to securely store value over time. Currency coins often don’t have Turing-complete protocols that enable sophisticated smart contracts on the first layer of their distributed network. This include first generation cryptocurrencies, such as Bitcoin, Litecoin, and Bitcoin Cash.
- Utility coins and tokens that enable smart contracts are considered second generation cryptocurrencies. Smart contracts are automated contractual agreements that are stored by a group of different computers controlled by often conflicting parties and strangers. This group includes coins such as Ethereum, EOS, and Stellar.
- The third generation of cryptocurrencies are stablecoins. Stablecoins are normally ERC-20 tokens built on top of Ethereum’s blockchain that maintain relatively stable purchasing power over time in terms of real goods and services in the economy. Stablecoins include Tether, USDC, and also stablecoins issued on public and permissionless distributed network like MakerDao Sai.
- Privacy coins are an offshoot of the first-generation cryptocurrencies. They are often volatile in price and have additional features that obfuscate information about each transaction including the wallet addresses of the sender and receiver and the transaction amount. This includes coins such as Dash, Monero, Zcash, Beam, Grin, and MimbleWimbleCoin.

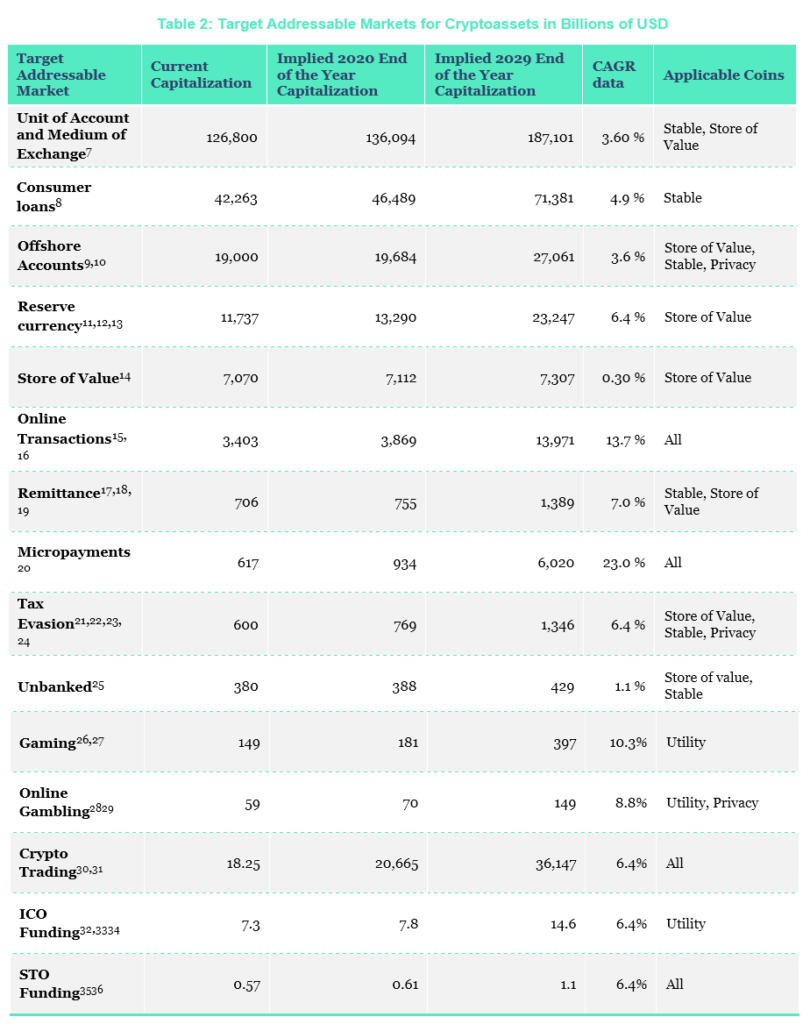
Once we know which coins are demanded for which use cases, we need to calculate the demand for each use case. The values for each target market can be additive or cannibalistic; meaning there can be either dual demands on a single supply or the demands are mutually exclusive and should not be added. Table 2 presents the assumed TAMs for cryptocurrencies including remittance, tax evasion, offshore accounts, store of value, online transactions, micropayments, STO and ICO funding, crypto trading, gaming, online gambling, unbanked, consumer loans, unit of account and medium of exchange, and reserve currency.
To project the TAM of future years, a reasonable assumption about the growth of this market going forward is required. This paper assumes a compound annual growth rate for each TAM. Some of the categories listed above lack reliable CAGR data. For those, we have assumed an estimate based on the CAGR of the S&P 500 index over the period from 2000 to 2018 because a reasonable assumption of the growth rate could be the long-term growth of the world economy. Furthermore, we believe that some of the CAGR values for the other categories might be inflated due to the long bull run over the last 10 years. A well overdue market correction is likely to drive them down at least by 20–30 %. The Corona virus’ V-shaped recovery is obviously sustained by devaluing fiat currencies, which itself isn’t sustainable. Therefore, the market capitalization for each TAM is most likely an upper bound.
(PQ) is normally measured as gross domestic product (GDP) in traditional economic models. However, speculation on financial assets is normally left out of GDP metrics. Foreign exchange volume isn’t included in GDP for example. Estimates that approximately 30 % of a cryptoasset’s on-chain transaction volume comes from investor speculation as they transfer cryptocurrencies between exchanges. Therefore, calculating PxQ by on-chain transaction volume is a noisy signal. Also, forecasting PxQ in the future by transaction volume today has a large estimation error. Instead, focusing on the target addressable markets and the growth in those markets is a better estimate.
Given the wide variety of TAMs listed in this table, a detailed look at individual, particularly important, use cases seems necessary. We will therefore continue at this point in the next week. We will take a look at offshore accounts, reserve currencies and store of value, among other things, in order to create a comprehensive picture of the usability of cryptocurrencies, which is so important for their stability.
7 Jeff Desjardins, “All of the World’s Money and Markets in One Visualization,” Visual Capitalist, October 26, 2017. Retrieved from http://money.visualcapitalist.com/worlds-money-markets-one-visualization-2017/
8 “Global consumer lending: size, segmentation and forecast for the worldwide market,” The Free Library, May 4, 2016. Retrieved from https://www.thefreelibrary.com/Global+consumer+lending%3A+size%2C+segmentation+and+forecast+for+the…-a0451297122
9 Kenneth Rapoza, “Tax Haven Cash Rising, Now Equal To At Least 10% Or World GDP,” Forbes, September 15, 2017. Retrieved from https://www.forbes.com/sites/kenrapoza/2017/09/15/tax-haven-cash-rising-now-equal-to-at-least-10-of-world-gdp/#2678190870d6; “Global GDP (gross domestic product) at current prices from 2010 to 2022 (in billion U.S. dollars),” Statista, 2019. Retrieved from https://www.statista.com/statistics/268750/global-gross-domestic-product-gdp/
10 Jannick Damgaard, Thomas Elkjaer, and Niels Johannesen, “Piercing the Veil”, IMF, June 2018. Retrieved from https://www.imf.org/external/pubs/ft/fandd/2018/06/inside-the-world-of-global-tax-havens-and-offshore-banking/damgaard.htm
11 Richard Leong, “U.S. dollar share of global currency reserves fall further – IMF,” Reuters, July 1, 2018. Retrieved from https://www.reuters.com/article/uk-forex-reserves/u-s-dollar-share-of-global-currency-reserves-fall-further-imf-idUSKBN1JR21G
12 Used S&P CAGR, due to lack of data
13 IMF, Currency composition of official foreign exchange reserves. Retrieved from http://data.imf.org/?sk=E6A5F467-C14B-4AA8-9F6D-5A09EC4E62A4
14 Sean Williams, “How Does Bitcoin’s Market Cap Stack Up Next to Gold, the S&P 500, and the U.S. Dollar?,” The Motley Fool, August 17, 2017. Retrieved from https://www.fool.com/investing/2017/08/17/how-does-bitcoins-market-cap-stack-up-next-to-gold.aspx; Martin Fridson, “Time To Go For Gold?,” Forbes, August 12, 2016. Retrieved from https://www.forbes.com/sites/investor/2016/08/12/time-to-go-for-gold/#74f2f6622969
15 “Digital Payments,” Statista, 2019. Retrieved from https://www.statista.com/outlook/296/100/digital-payments/worldwide
16 Digital Payments Market – Growth, Trends and Forecasts (2020–2025). Retrieved from https://www.mordorintelligence.com/industry-reports/digital-payments-market
17 Toby Shapshak, “Global Remittances Reach $613 Billion Says World Bank,” Forbes, May 21, 2018. Retrieved from https://www.forbes.com/sites/tobyshapshak/2018/05/21/global-remittances-reach-613bn-says-world-bank/#6d1d2d625ddc
18 2019 World Bank data. Retrieved from https://www.worldbank.org/en/topic/migrationremittancesdiasporaissues/brief/migration-remittances-data
19 World Bank Group, “Migration and Remittances,” April 2019. Retrieved from https://www.knomad.org/sites/default/files/2019-04/Migrationanddevelopmentbrief31.pdf
20 Medici Team, “Payment Entrepreneurs go after MicroPayments segment; $13 B+ Opportunity globally,” Medici, February 1, 2014. Retrieved from https://gomedici.com/payment-entrepreneurs-go-micropayments-segment-13-b-opportunity-globally/
21 Niall McCarthy, “The Global Cost of Tax Avoidance,” Statista, March 24, 2017. Retrieved from https://www.statista.com/chart/8668/the-global-cost-of-tax-avoidance/
22 Used S&P CAGR, due to lack of data
23 Nicholas Shaxson, “Tackling Tax Havens”, IMF, September 2019. Retrieved from https://www.imf.org/external/pubs/ft/fandd/2019/09/tackling-global-tax-havens-shaxon.htm
24 Petr Janský, “Hearing on Evaluation of Tax Gap,” Charles University, Prague, Czechia, 23 January 2019. Retrieved from http://www.europarl.europa.eu/cmsdata/161049/2019%2001%2024%20-%20Petr%20Jansky%20written%20questions%20-%20Ev_TAX%20GAP.pdf
25 Jeff Desjardins, “Banking the Unbanked is a $380B Opportunity,” Visual Capitalist, July 20, 2017. Retrieved from https://www.visualcapitalist.com/banking-unbanked-emerging-markets/
26 Tom Wijman, “Mobile Revenues Account for More Than 50% of the Global Games Market as It Reaches $137.9 Billion in 2018,” Newzoo, April 30, 2018. Retrieved from https://newzoo.com/insights/articles/global-games-market-reaches-137-9-billion-in-2018-mobile-games-take-half/
27 Teodora Dobrilova, “How Much Is the Gaming Industry Worth?,” April 4, 2019. Retrieved from https://techjury.net/stats-about/gaming-industry-worth/#gref
28 “Global Gambling Industry: State of Play in 2018,” Casino.org, 2018. Retrieved from https://www.casino.org/gambling-statistics/
29 Online Gambling Market – Growth, Trends and Forecasts (2019–2024). Retrieved from https://www.mordorintelligence.com/industry-reports/online-gambling-market
30 “Global Charts,” CoinMarketCap, 2019. Retrieved from https://coinmarketcap.com/charts/
31 Used S&P CAGR, due to lack of data
32 “Cryptocurrency ICO Stats 2018,” CoinSchedule, January 27, 2019. Retrieved from https://www.coinschedule.com/stats.html?year=2018
33 Used S&P CAGR, due to lack of data
34 5th ICO / STO Report, PWC, Summer 2019. Retrieved from https://www.pwc.ch/en/publications/2019/Strategy&_ICO_STO_Study_Summer_2019.pdf
35 Ibid.
36 Token sale statistics. Retrieved from https://www.coinschedule.com/stats/