“Technical analysis is not the holy grail but the best approach to grasp the hyper complex markets at a glance.”
Florian Grummes
Key Takeaways
- Technically, Bitcoin and thus the entire crypto sector was definitely in a bear market until the end of March 2019. Since the sharp outbreak of over $4,150 and the rise to $5,330, however, the situation is no longer quite so clear.
- At the moment, the Fear & Greed Index is increasingly providing warning signals and indicates that market participants are too optimistic or greedy. At any rate, the ideal time to buy based on sentiment analysis is now clearly behind us.
- As long as Bitcoin cannot regain the psychological $6,000 mark, any price recovery remains only a bear market rally below the decisive resistance zone.
Winter has had a firm grip on the crypto sector for over a year. However, we were able to see who was swimming naked when the tide went out. The last two months saw a bottoming out and respectable recovery. The price has already increased $2,200 from the low of $3,125. This is an increase of almost 70%. This recovery may merely be a temporary thaw. However, it could also be the beginning of spring.
Review
Last year, in the March 2018 edition of the Crypto Research Report, we suggested a further correction could occur and warned about a potential crypto winter, when Bitcoin was still trading at over 11,500 US dollars.(1) Since then, prices have ultimately only gone further south despite sharp and profitable counter-movements. With the failure of the round psychological mark of $10,000 at the end of April 2018, a series of even lower highs could no longer be stopped. Nevertheless, Bitcoin prices were able to remain above $6,000 during the summer. It was not until autumn that this extremely important support became fragile.

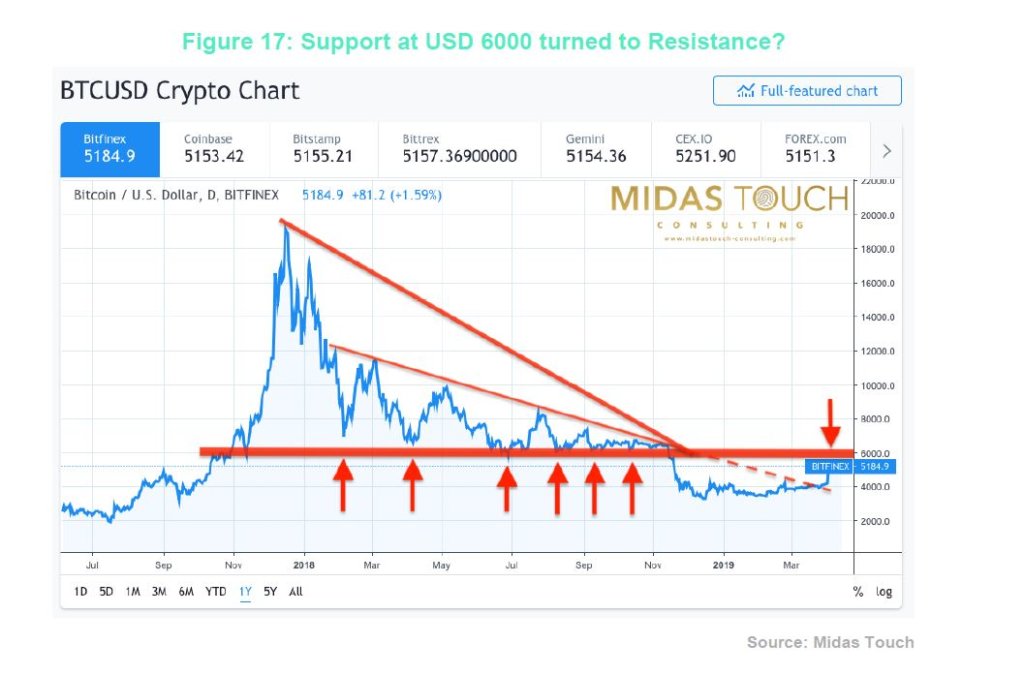
Technically speaking, Bitcoin has had a descending triangle/ bearish wedge (2) during the first 10.5 months of 2018. After bouncing off the support zone around $6,000 six times and at the same time establishing a series of lower highs, it was just a question of time before the support around $6,000 would break. Breaking such a strong support makes any market crash. A similar formation in the goldmarket occurred in 2013, when gold was priced around $1,520. The same is true in an uptrend as well. The more often a market runs against a resistance zone the less strong the resistance line becomes. This is similar to Bitcoin’s resistance around $1.000-$1.200. It took a few attempts before Bitcoin finally broke through that number to the upside. After that, the massive rally in 2017 really started to gain steam.
Further falling prices were also suggested by us in the October edition of the Crypto Research Report. (3) Consequently, after the $6,000 support was broken, Bitcoin’s price halved again. However, a non-laughable recovery of 70% has been observed since mid-December when Bitcoin hit its low of $3,125. Meanwhile, Bitcoin is trading around $5,000, and has completed its first bottom formation. However, Bitcoin will experience numerous resistances levels going forward!

Parallel to the bleak price development of Bitcoin, most Altcoins had lost between 80% and 100% of their peaks. Many projects have now been buried. Fraud, mismanagement, and lack of a good business model were widespread. Rightly so, utility coins garnered a shady reputation for the entire blockchain industry.
However, we are still convinced that the public blockchain technology has fundamental value as a non-confiscatable asset for wealth preservations. Highly motivated and specialized tech teams worldwide are still working in the background on the further development of numerous blockchain and crypto projects such as Blockstream’s Liquid, the Lightning Network, and Plasma. Therefore, the epic popping of the 2017 bubble could actually offer an enormous opportunity. Generally, small investors lack knowledge and discipline, and trade and invest very emotionally. They usually don’t have deep pockets and give up at the lows and buy at tops. Smart money, which is not necessarily institutional money, does the opposite: buying when prices are low and nobody is interested, while selling once everybody wants to buy. Strong hands have a plan and are patient. Right now, crypto markets are quiet, and investors can slowly accumulate during this depressed environment. To handle the volatility of the cryptocurrency market, a radically countercyclical approach is needed.
Is Bitcoin Dead?
Of course Bitcoin isn’t dead. Even though the first crypto currency has only existed for a decade, the Bitcoin has been declared dead countless times. During this period, however, the value of a Bitcoin rose from 0.003 US dollars to almost 20,000 US dollars in the meantime. Basically an incredible success story! And even at current exchange rates of around 5,000 US dollars, you still have to pay almost four times as much for a Bitcoin as for an ounce of gold.
The collapse of the crypto sector is weeding out the bad business models. A similar situation occurred after the bursting of the dotcom bubble at the beginning of 2000/2001. More than 75% of the tech companies founded during the Internet boom in the late 1990s went bankrupt. But some of the biggest and most powerful companies of all time emerged from the ashes: Amazon, Google and eBay, for example, not only survived the crash, but are now an integral part of our everyday lives. The share prices of these companies have increased more than a hundredfold in the last 15 years. The same can be expected for the cryptocurrency market over the next ten year.
Of course, the market capitalization of the entire sector, currently around $160 billion, is negligibly low compared to other sectors and is far removed from the almost $850 billion in January 2018. The daily trading volume, at just under $30 to 40 billion, is also 60% below its highs of December 2017. Many small investors either sold their crypto investments at high losses or are blindly holding onto their underwater positions. At any rate, speculative money has left the sector at the moment. This lack of speculative money can also be observed by the decline in blockchain conference participants throughout Switzerland. Conference organizers have to give free tickets away in order to fill the hall.
Market Sentiment in the Short and Medium Terms
The mood in the crypto sector reached an absolute low in mid- December. One tool for determining the exact trend reversal point is the Fear & Greed Index. The index reached a low of 10 in mid-December, which lasted several months. As in all asset classes, returns are based on the individual behavior of countless market participants. The vast majority of buying and selling decisions are made very emotionally. Medium-term turning points often observe extreme fear or blind greed. Mass psychology is an underlying factor drives prices in any market. At market tops like the one in December 2017/January 2018, everybody is bullish and invested. Exactly at this stage you can observe blind greed. At bottoms the contrary is true, everybody is afraid, depressed and has lost his beliefs plus sold his positions in blind panic.

Generally, sentiment analysis makes the following assumptions: extreme fear can be a sign that investors are worried. That could be a buying opportunity. When investors are getting too greedy, that means the market is due for a correction. The Fear & Greed Index consists of five different data sources and is calculated automatically on a daily basis. Values of 0 mean extreme fear, while the maximum value of 100 stands for extreme greed and exuberant optimism. The index is comprised of several variables. Bitcoin volatility makes up 25% of the index. An unusually high volatility is a sign of an anxious market, similar to the stock market. The market momentum or trading volume contributes a further 25% to the index calculation. Market sentiment on social media including keywords on Twitter, are weighted 15% in the calculation. Weekly surveys among crypto investors and the Bitcoin dominance compared to the more speculative Altcoins make up 15% and 10% of the index respectively. The index is rounded off with various Bitcoin search queries (Google Trends data), which provide the last 10% for index calculation. An example of this is the query “Bitcoin price manipulation”, which is clearly a sign of increased fear in the market.

At the moment, the Fear & Greed Index reads high optimism values, which could be a cause for concern. According to market sentiment analysis using the Fear and Greed index, the ideal time to buy based on sentiment analysis is already behind us. It should also be noted that an extreme euphoria can rarely be observed in a bear market. Should it arise, it must be interpreted as a good sell signal. If a market is in a bear market, which we are, then any rally/recovery will create too much optimism, which cannot be fully supported while the overall trend is still down. The most extreme number for this sentiment index was around 75, therefore, 51 is not extreme optimism but rather this is moderately too optimistic.

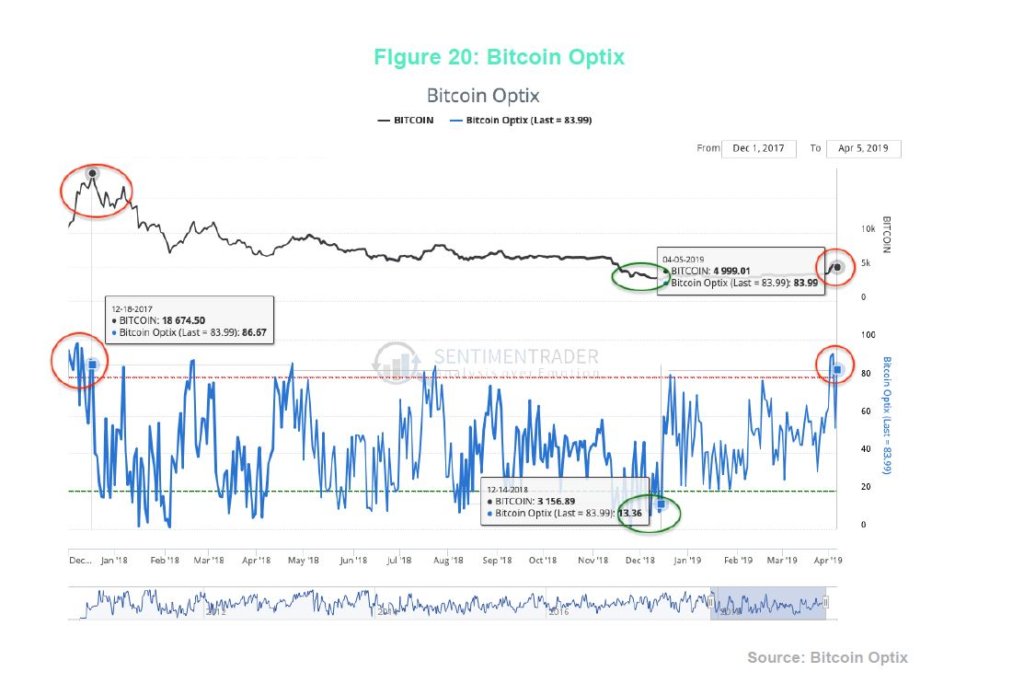
The Bitcoin Optimism Index (Optix) published by Sentimenttrader currently comes to a similar conclusion. Sentimentrader.com do not share their formulas; however, each measure is ranked against its historical norms to determine whether or not the current level is at an extreme. The Optix can go from 0 (maximum pessimism) to 100 (maximum optimism), though it generally stays above 20 and below 80. As with most contrary indicators, when sentiment gets extremely pessimistic, below 30, we would become alert to a possible reversal to the upside as expectations improve from very low levels. When sentiment is very high, above 70, then we would become concerned about a correction as expectations may have gotten too optimistic.
For bitcoin, the Optimism Index has worked best when using a moving average, such as 10 days. “There is curretly a neutral optimism indicator. The psychological low of the last mass panic was measured on December 14, 2018. The calculation is based on future volatility expectations, the average discount of an unspecified Bitcoin fund against its net asset value and general price behavior. Overall, the sentiment analysis recommends a wait-and-see approach in the short term.
Technical Analysis: Possible Price Targets and
Accumulation Zone
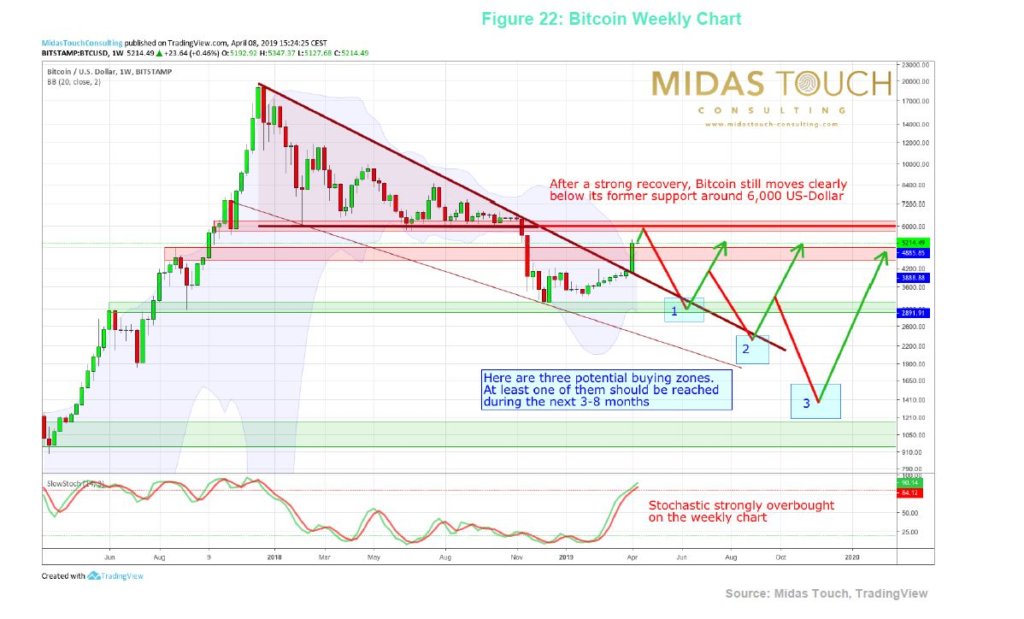
Technically, Bitcoin and thus the entire crypto sector was definitely in a bear market until the end of March 2019. Since the sharp outbreak of over $4,150 and the rise to $5,330, however, the situation is no longer quite so clear. On the one hand, the downward trend line of the last sixteen months was clearly broken and since the low of December, the share price has already risen by over 70%. On the other hand, the price continues to move clearly below the former support zone by $6,000 – 6,200, while the stochastic oscillator on the weekly and daily charts is completely overbought. As long as the Bitcoin cannot regain the psychological level of $6,000, any price recovery remains only a bear market rally below the decisive resistance zone.

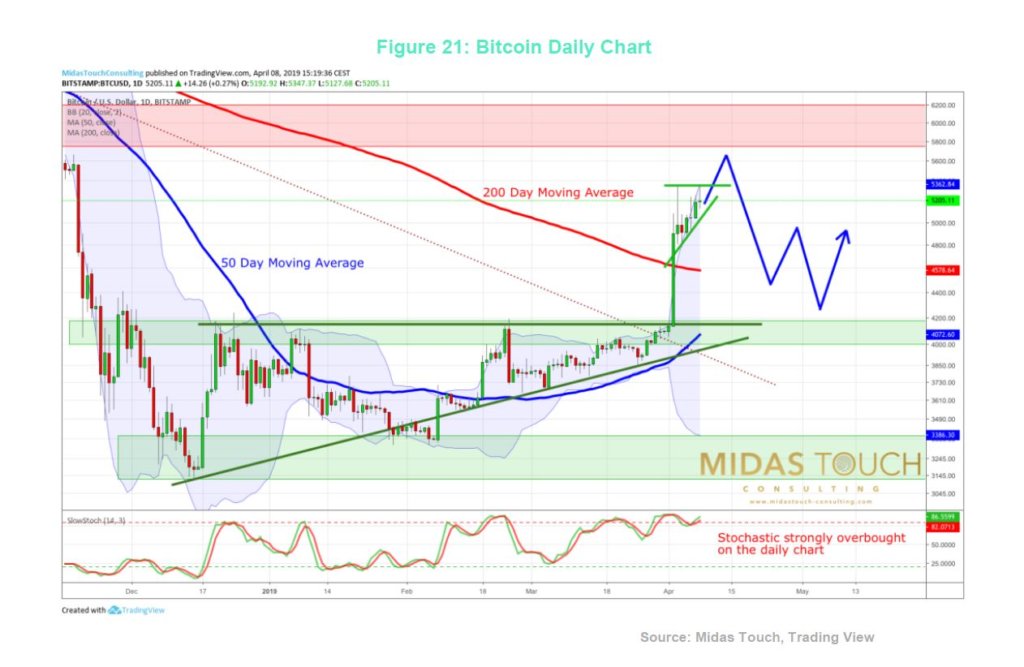
At the end of March, the Bitcoin was able to free itself from its threeand- a-half months of soil formation on the daily chart. The rise above 4,150 US dollars resulted in massive short covers, which drove prices up almost vertically. The price target from the ascending triangle was in principle worked off at 5,330 US dollars.
As a further rising triangle is emerging in the very short term, the Bitcoin exchange rates could also rise to 5,700 – 5,800 US dollars in the coming days and weeks. However, the resistance around 6,000 US dollars is extremely strong and should by no means be underestimated.
Of course, the newly established series of higher lows is positive. The strongly overbought Stochastic Oscillator, on the other hand, is negative. In any case, the air is now getting thinner and thinner with every further rise.
The imminent setback should lead at least to the still falling 200-day line (4,575 US dollars). It is also possible that only the rising 50th day line will catch the reset. In any case, the constellation of the two moving averages indicates that there is still some need for consolidation overall.
The large picture therefore still lacks a clear trend reversal. In the months to come, an irritating sideways phase is more likely to be planned. Similar to the closing of the last bear market in late summer 2015, a final slip of less than 3,000 US dollars might even be 1,500 US dollars. Only then would the sector be ready for a new bull market. 2019 should therefore be a year of transition.

However, as soon as the Bitcoin manages a weekly closing price above 6,200 US dollars, all bearish doubts will be dispelled. Then we have to assume that the correction has already reached its final low in December and that the Bitcon is already in a new upward wave. In this case we have to buy every backstop (Buy The Dip).
(1) Technical Analysis: Is a Crypto Winter About to Start? Grummes (2018). Crypto Research Report, pg. 51
(2) See “Descending Triangle”, www.stockcharts.com
(3) The Network Effect As a Valuation Methodology. Hays and Zapke (2018). Crypto Research Report, pg. 42

