
“The high stock-to-flow ratio, the liquidity of the market, and its unique features as a monetary good set gold apart from all other asset classes and make it an efficient hedge against systemic market risk.”
In Gold We Trust Report 2011, Page 26
- The “Plan B” valuation model for the development of Bitcoin’s price quickly gained worldwide attention. In it, the price of Bitcoin is modelled with the “stock-to-flow ratio”, a proxy for scarcity.
- Historically, the stock-to-flow ratio was an almost perfect exogenous regressor for the development of the price of Bitcoin (R2 was 95%).
- According to the model, the price of Bitcoin should rise to USD 55,000 after the next “halving” in May.
What is the Stock-to-Flow Ratio?
Since the article “Modeling Bitcoin’s Value with Scarcity” appeared on the online platform Medium in March 2019, it has already been translated into over 25 languages and will soon spread worldwide. But what exactly is it all about and what conclusions can be drawn from it? In the following article, we’ll explore these and other questions.
The basis for the entire model is the so-called “Stock-to-Flow Ratio”, a concept that interested readers of the Crypto Research Report and its sister report, the “In Gold We Trust Report“, have been familiar with for many years. For those who are not yet familiar with the concept or who would like to refresh their knowledge of it, please refer to the info box on the left.
The author of the article, who blogs under the pseudonym “Plan B”, dared to try to model the price of Bitcoin with the “Stock-to-Flow Ratio” (hereinafter SF). The concept, which was originally applied to gold and other precious metals, hit the Bitcoin scene like a bomb. How did it come about that a concept for commodities could be applied to a cryptocurrency?
| The Stock-to-Flow Ratio The stock-to-flow ratio is a ratio of two figures corresponding to raw materials, which can ultimately be used for price modeling. The term “stock” refers to how much of a certain raw material is mined or would potentially be in stock if the entire stock was offered. In this concept, “flow” stands for the production quantity within a certain period, usually within one year. If you now compare these two figures, you will see relatively quickly that this can be used as a measure of the constancy of the quantity of raw materials. An example: While the total amount of gold ever mined is about 190,000 tons (stock), the annual production is about 3,000 tons (flow). If you divide the stock by the flow, you get a stock-to-flow ratio of 63.3, which means that at the current production level, it would take more than 63 years to double the gold stock or rebuild the current stock. So, the larger the number, the more constant is the raw material that is examined. While the “stock” is a given size and grows yearly exactly around the “flow”, the “flow” depends on various factors, such as the rarity, the price and the difficulty of extracting the raw material. |
Bitcoin, Gold and Scarcity
Two main factors contribute to the value of gold–– the most important precious metal for investors:
1. The Relative Rarity
2. The Difficulty of Extraction or The Extraction of the Raw Material.
Similar to gold, Bitcoin is both scarce and expensive to extract. Therefore, an analysis of the price development of Bitcoin with the SF model, which was originally designed for commodities, seems to be reasonable due to its similarity to gold.
Figure: Bitcoin vs. Gold – Stock-to-Flow-Ratio
Source: Medium Original Article, ZPX, Satoshi & Co. Research
The Quantitative Valuation of “Plan B”
A special feature of the Bitcoin protocol is that the code already determines how the Bitcoins offering – and thus the stock to flow ratio – will develop in the future.
The maximum number of Bitcoins is 21 million (maximum stock). The number of newly generated Bitcoins is also fixed (flow). However, the Bitcoin flow is not constant over time. Every 210,000 blocks the so-called “block-reward” is halved. This is the number of Bitcoins that the successful miner receives for its validation services. Miners currently receive 12.5 Bitcoins per block, but the next “halving” will take place in May of this year. From then on, only 6.25 Bitcoins per block will be “mined”.
| By way of comparison, in the case of gold or silver, for example, it cannot be completely ruled out that one day a huge find will be made, and the flow will shoot up, because more can be mined. |
| The “Halvings” lead to: Inflation of Bitcoin getting smaller and smaller until it reaches zero, and an increasing SF ratio as the flow is halved. |
| Since Bitcoin is denominated to eight decimal places, the reward per block will arrive at 0 exactly after the 33rd “halving”. Based on a halving every four years, the last Bitcoin will therefore be mined in 2140. |
Table: Development of the “Block Rewards”
| Period | Number of New Bitcoins per Block |
| Genesis Block – November 2012 | 50 |
| November 2012 – July 2016 | 25 |
| July 2016 – May 2020 | 12,5 |
| May 2020 ~ May 2024 | 6,25 |
| May 2024 ~ May 2028 | 3,125 |
Source: Incrementum AG
Plan B examined a total of 111 data points between December 2009 and February 2019 and determined the respective market capitalization of Bitcoin and the corresponding SF ratio.
| Important Links: Live BTC Stock-to-Flow: DIGITALIK: https://digitalik.net/btc LOOKINTOBITCOIN: https://www.lookintobitcoin.com/charts/stock-to-flow-model/ The Original Article: https://medium.com/@100trillionUSD/modeling-bitcoins-value-with-scarcity-91fa0fc03e25 |
| Because the S2F ratio is constantly increasing, time is already included in the model as an exogenous variable. |
Then the author pulled the data and one thing was immediately apparent: The higher the SF ratio, the greater the market capitalization. If one regresses the rising stock to flow ratio with the logarithmic price time series of Bitcoin, one finds a surprisingly high explanatory value. The correlation can also be seen with the naked eye.
| The natural logarithm was used. This makes it possible to show the correlation of both quantities linearly and thus opens up possibilities for a solid statistical investigation. |
Figure : Plan B’s Infamous Graphic
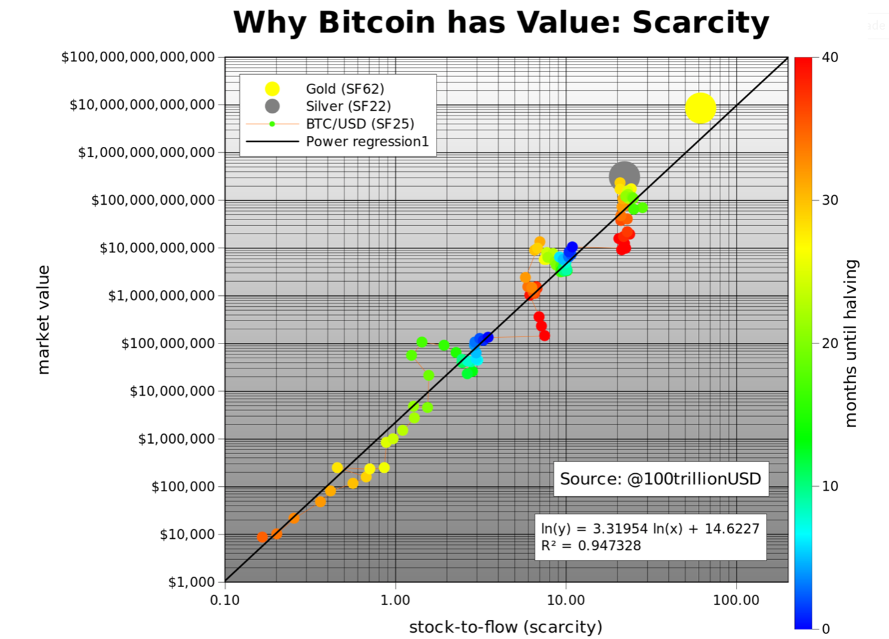
Source: Plan B, Medium[1]
| For the Number Crunchers: If one models the price of BTC directly by SF and converts the resulting formula In (Market Capitalization) = 3.3 * ln(SF) + 14.6 Then you get the law of potency: Market Capitalization = Exp(14.6) * SF3.3 |
In Plan B’s infamous stock to flow chart, the small dots represent Bitcoin’s historical price data over time. The large grey and yellow dots show the respective market capitalization of silver and gold and their respective stock to flow ratio. The regression suggests what can be seen with the naked eye: a statistically significant relationship between S2F Ratio and the market capitalization of Bitcoin.
| For the Number Crunchers: Test Data of the Regression: R2: 0.95 F-Test: 2.3E-17 P-Value: 2.3E-17 |
Plan B argues that the correlation is so strong that the dominant driver for the price must be scarcity, or SF ratio. However, the author also acknowledges that other factors such as regulatory measures, hacks, and other news have an impact on the price; therefore, not all the data points are perfectly in line. The fact that the S2F ratio of gold and silver also fits very well into the picture is a further validation of the model.
Since the “halvings” have such a great influence on the SF ratio, Plan B has color-coded the months until the next “halving” in the chart. Dark blue are the halving months and red are the points shortly after the “halving”. The current S2F ratio of ~25 will thus double to ~50 in May 2020, which is already close to the S2F value of gold. Based on this model, the forecast market value for Bitcoin after halving in May 2020 is $1 trillion, which would correspond to a Bitcoin price of $55,000.
Further Models
We dug a little deeper and found out that there were already several variants of the model that Plan B calculated:
| Points of Criticism with the “Plan B” Model The model is based purely on the supply side (maximum number, Bitcoins per block, etc.) and does not take into account the demand for Bitcoins.Regulatory measures, possible hacks, etc., i.e. (largely non-quantifiable) control variables, are not included or built into the model. • Historical data is not a source of forecasts. • The statistical correlation between the SF ratio and the price of Bitcoin is not a causality, only a correlation. • If the model is correct, this should already be reflected in the prices. • At some point Bitcoin will become truly deflationary (the loss of BTC per year would exceed the annual mining production), resulting in a negative SF ratio. What happens to the price then cannot be predicted by the model. Lack of stationarity of the data. The high R2- value could be a consequence of the missing stationarity of the data.The empirical work of Plan B is not precisely documented, which makes it difficult to find methodological weaknesses. |
Another interesting model is the so-called “time-based model”, as it explains the increase in the value of Bitcoin over time with a different underlying causality. The model states that Bitcoin increases in value as more and more market participants know about Bitcoin, deal with it and take the step to buy it. The narrative for the increase in value is thus the adoption, but not the scarcity (S2F). The estimates of this model are more conservative, and it is assumed that the price of Bitcoin will not break the $100,000 barrier until 2021-2028.
Table: Bitcoin Price Development Model Overview
| Model | Original Model (Until Dec 2018) | “Additional Data Model” | “Out of Sample” Model | “Time-Based” Model |
| Value After the 2020-Halving | 55,000 USD | 60,000 to 9,000 USD | 100,000 USD | Between 2021 & 2028: 100,000 USD |
| Special Feature | The first rapidly spreading model for price evaluation of Bitcoin with scarcity as proxy. | Supplements “The Original” with additional data (older and younger). | Uses only data prior to November 2012, so no halving has occurred in the data set yet. | The reason for the price growth in this model is the progressive adoption of Bitcoin. |
Source: Incrementum AG, Plan B
The Law of Potency
| “S2F and price are proportional and react and change proportionally.” Plan B, Stephan Livera Podcast November 2019 |
Definition: “A power law is a relation in which a relative change of one quantity leads to a proportional relative change of the other quantity – independent of the initial quantity of these quantities”.
Exactly such a law of potency emerges when one examines the regression of the “original model”: At each halving, the SF ratio doubles, and market capitalization increases tenfold – this is a constant factor. Plan B therefore suggests:
“The possibility of a power law with a 95% R2 over eight orders of magnitude makes me confident that the main driver of the Bitcoin value is correctly captured by the SF ratio”.
Conclusion
The stock-to-flow model has shaped the crypto year 2019 like no other
development. The accuracy with which the model traces price developments of the
past is outstanding. It was also possible to observe how the model drove
additional researchers and critics to take a closer look at the price
development of Bitcoin. In the medium and long term, this invested human
capital will contribute to a better understanding of the crypto world and its adoption
to a broader population. The partly heavily criticized Model from “Plan
B” will have the opportunity to prove itself as a forward-looking
achievement starting this May – and it deserves exactly this opportunity.
[1] https://medium.com/@100trillionUSD/modeling-bitcoins-value-with-scarcity-91fa0fc03e25
[2]
See Stephan Livera and Plan B, Nov 4, 2019
https://stephanlivera.com/episode/122/


