
“… ether itself will retain a strong and steady value as a cryptofuel, and as a store of value for Ethereum-based security deposits, simply because of the combination of the Ethereum blockchain’s network effect (which actually is a platform network effect, as all contracts on the Ethereum blockchain have a common interface and can trivially talk to each other).”
Vitalik Buterin, Founder of Ethereum
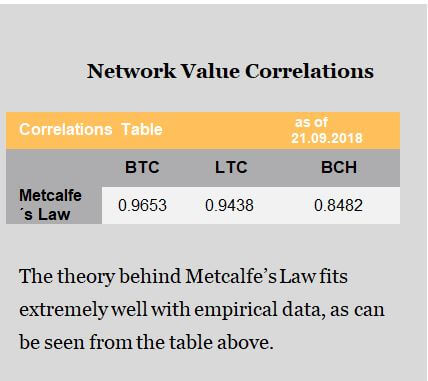
A hot topic at conferences in the US is how to value cryptocurrencies. There are two main models: absolute and relative. Absolute valuation allows investors to calculate a “fair” price for each asset. Then the investor can compare the theoretical “fair” price to the real price that the asset is selling for on the market. If the price on the market is higher than the “fair” price, then the investor receives a sell signal and vice versa. On the stock market, analysts calculate the net present value of future firm revenues or of dividends to arrive at what the stock should be priced at today. In contrast, relative valuation models allow investors to compare several assets. Relative valuation models are often ratios such as the Price-to-Earnings (P/E) ratio which compares the price of an asset to the earnings of a company.[1] Cryptocurrency analysts adapted this general valuation framework by computing each crypto asset’s Network Value to Metcalf (NVM) ratio, Network Value to Transactions (NVT) ratio, and a metric that combines the concepts used in the two prior ratios called Network Value/Transactions to Growth (NVTG) ratio. Higher ratios mean a cryptocurrency is overbought relative to other coins.
In this chapter we develop relative valuation models to help investors compare various cryptocurrencies. Our calculations suggest that the cryptocurrency market is still overvalued because the market capitalization is not justified by the number of active users or the daily on-chain transaction volume. We focus our analysis on Bitcoin, Bitcoin Cash, and Litecoin and find that Bitcoin is a better investment than Bitcoin Cash or Litecoin. However, the caveat is that this is only one indicator out of several that one can use for making investment decisions.
The Network Effect
In the 1980s, Robert Metcalfe, an employee at the Xerox Palo Alto Research Center (PARC), devised a novel theory about the value of communication systems.[2] The theory later became known as Metcalfe’s Law. His original intent was to describe the purchases and connections of the Ethernet, which was a predecessor to the Internet.
Today, the theory is used to value a network and its users, such as Internet businesses like Facebook and eBay. Metcalfe’s model proposes a relationship between the value of a network and its size, typically measured in number of users.[3] More specifically, he argued that the value of a network is proportional to the square of network nodes (users). For example, assume the social media network Pinterest has n users, then the utility each user derives from the network is proportional to (n – 1), namely the number of potential connections in the network. This relationship between utility and users is the so-called network effect. If an additional user joins the network, it increases the utility of the others, and assuming that all connections are equally valuable, the total network value should result proportional to n*(n – 1), which in turn is asymptotically proportional to n².
Metcalfe’s Law Applied to Crypto Assets
Much like online networks, crypto assets are networks of users that are connected in digital space that can interact with other users. Metcalfe’s law means that as more people adopt cryptocurrencies, the more utility each user derives from the network. Ultimately, the result is a proportionately higher network value.
In an effort to define the role of network effects and understand their consequences in the cryptoeconomic context, Vitalik Buterin outlined the main reasons a large network increases the value of a cryptocurrency.[4]
1.) Security effect: systems that are more widely adopted derive their consensus from larger consensus groups, making them more difficult to attack.
2.) Payment system network effect: payment systems that are accepted by more merchants are more attractive to consumers, and payment systems used by more consumers are more attractive to merchants.
3.) Integration network effect: third party platforms will be more willing to integrate with a platform that is widely adopted, and the greater number of these tools will make the platform easier to use.
4.) Size stability effect: currencies with larger market cap tend to be more stable, and more established cryptocurrencies are seen as more likely (and therefore by self-fulfilling prophecy actually are more likely) to remain at non-zero value far into the future.
5.) Market depth effect: larger currencies have higher market depth on exchanges, allowing users to convert larger quantities of funds in and out of that currency without taking a hit on the market price.
6.) Interpersonal single-currency preference effect: users prefer to use the same currency that others are using to avoid interchange fees when making ordinary transactions.
7.) Intrapersonal single-currency preference effect: users that already use a currency for one purpose prefer to use it for other purposes both due to lower cognitive costs and because they can maintain a lower total liquid balance among all cryptocurrencies without paying interchange fees.
Different types of crypto assets may exhibit different types of network effects as well: a payment token like Bitcoin will probably exhibit a stronger Interpersonal single-currency preference effect than a utility token like Ethereum.
Network Value to Metcalfe Ratio
After having gained an understanding of the role of network effects in crypto assets, we can now look at the concrete metrics used to assess their fundamental value suggested by network effects. The first one is applying Metcalfe’s Law directly to crypto assets and is called the Network Value to Metcalfe ratio. Its main purpose is to give a sense of how over or undervalued an asset is at the moment.

The more inflated the price is in relation to the utility that network users derive from it, as proxied by the network effect theory, the higher the expected correction towards the theoretical fundamental value implied by the model will be. That said, the model implies that the price of a crypto asset stands in a direct relation with a fundamental value measured by user utility in the long run and that some form of reversion to the mean takes place.[5]
The Network Value to Metcalfe ratio puts the respective law for describing the network effect in its denominator, while using market capitalization as a proxy for network value in its numerator. The number of network users (n) is approximated by the number of unique addresses that are active on a given day, meaning they are participating in sending or receiving transactions.[6] Unique addresses in the Bitcoin ecosystem are payment addresses that have a non-zero balance. While the number of unique addresses is not a perfect measure of the actual number of users on a given day, it generally holds that the more unique addresses are in use the more users the network has and vice versa. Since we are trying to arrive at a long-term fundamental metric, we additionally smooth the daily active user number to a 30-day moving average in order to get rid of stark daily fluctuations related to noise.
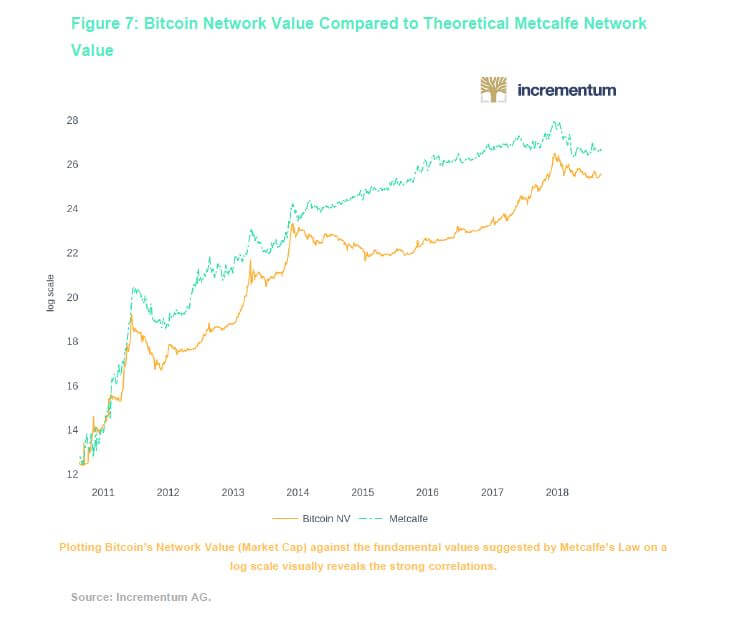
The first candidate for our analysis is Bitcoin: Plotting the Network Value of Bitcoin against its seemingly mean-reverting NVM ratio reveals a staggering relationship.

Large spikes in Bitcoins NVM ratio indicate that the network is being priced excessively high in relation to the number of active users and have historically almost always led to subsequent corrections in its market value. We can see this quite evidently during the periods of early 2011, mid-2012, early 2013 and late 2017. Remember that the orange trace corresponding to the market value of Bitcoin is depicted on a log scale. We transform all the subsequent historical network values to a logarithmic scale for purposes of a more convenient visualization. The y-axis on the chart above represents the log scale on the left and the current value of the NVM multiple on the right.
What we can see is that once NVM moves significantly above its long-term mean (0.21), there are reasons to be concerned about the future near-to middle-term evolution of Bitcoin’s market value. Conversely, an NVM well below its mean has typically meant a good buying opportunity. The current levels, however, indicate a worrying picture for the state of Bitcoin and strongly suggest a further downwards correction.
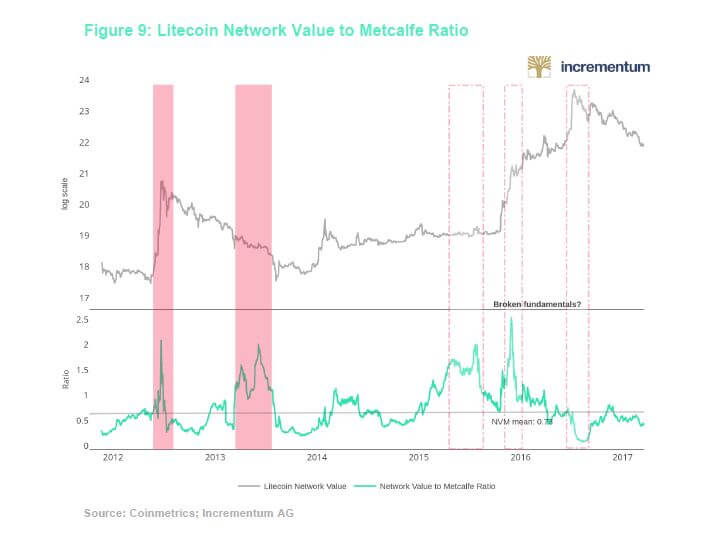
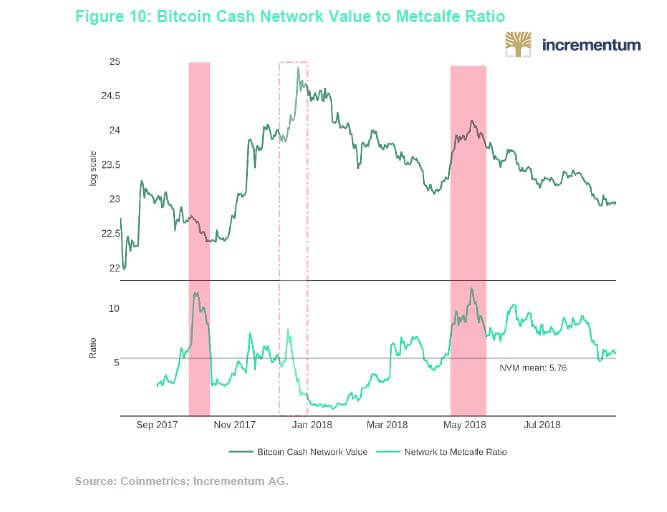
Similar patterns, although with less predictive power, arise in the case of Litecoin (LTC) and Bitcoin Cash (BCH). The quality of the latter is further diminished by its short history of data.
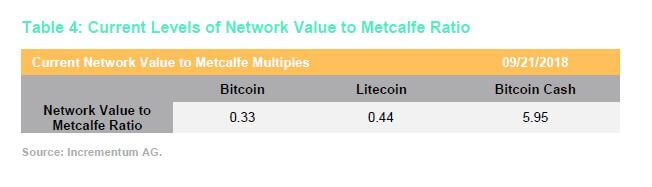
For Litecoin, spikes in NVM were mostly followed by corrections in its market value in subsequent periods. However, the most recent “bubble” in late 2017 has in no way been preceded by such a spike. This might be associated with the limitations we pointed out for NVM or with concerns inherent to the Litecoin network, such as the fact that Litecoin development has almost completely stalled, as evident from their Github activity, and Litecoin founder Charlie Lee has sold 100 % of his LTC stake. Overall, the multiples of BTC & LTC seem to be trading more or less in the same range of 0.01–2, while BCH has inherently exhibited a way more inflated scale, ranging from .90–11. The current ratios can be found in the following table below. According to relative valuation, BTC and LTC are overvalued equally compared to their user base, while BCH appears to be grossly overvalued.
Network Value to Transaction Ratio
Another valuable relative valuation metric that is related to the Network Value to Metcalfe ratio is the Network Value to Transaction ratio. If we think back to the P/E ratio found in traditional finance, earnings serve as a proxy for the value created for shareholders. If we try to apply this reasoning to crypto assets, we will find that most of them do not have earnings in the traditional sense. However, one can argue that there might be a positive relationship between the utility and consequently fundamental value of a network and the total value of transactions flowing through it. This idea is in line with the interpersonal and intrapersonal network effects discussed in the previous section by Vitalik Buterin.
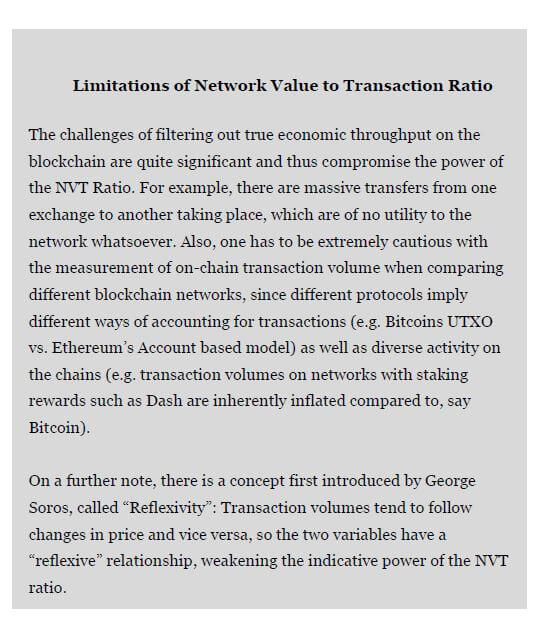
The most crucial part about the NVT ratio is defining the denominator, namely total transaction value, such that it truly proxies the utility conveyed to users. When looking at transaction volumes in the crypto space, there are currently two main venues where transactions take place: on-chain and off-chain. On-chain transactions refer to activity that occurs directly on the blockchain, while off-chain transactions typically refer to interactions on remote venues like cryptocurrency exchanges which are not directly documented on the blockchain.
Distinguishing volumes that proxy utility from those that do not is a true challenge in the crypto world and a lot of brainpower is going into that topic.[7] It is reasonable to assume that on-chain transaction volume is the closest we can get to measuring true economic output on the blockchain, which directly translates to user utility. We proxy the denominator in the NVT ratio with on-chain transaction volume as calculated by the Coinmetrics Team, which publishes their dataset under the name of “adjusted transaction volume estimates”.
Similarly, to NVM, we smooth the daily (on-chain & adjusted) transaction volume figures to a 30-day moving average to ensure that we solely capture a long-term fundamental trend. Using the total market capitalization as a proxy for network value as above, we obtain the following results presented in the figures below:
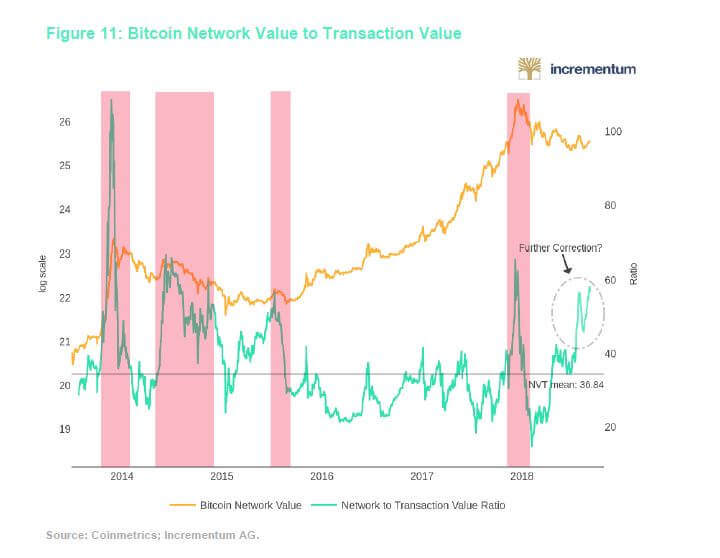
For Bitcoin, NVT shows high multiples (between 50–100) indicating a potential overvaluation and low multiples (between 0–30) signaling undervaluation. It is noteworthy that the current trend of NVT seems to be moving towards levels seen at the peak of the most recent bubble. This is true not only for BTC but also for LTC, while BCH’s valuation in relation to its transactions volume seems to have stabilized around its long-term mean.
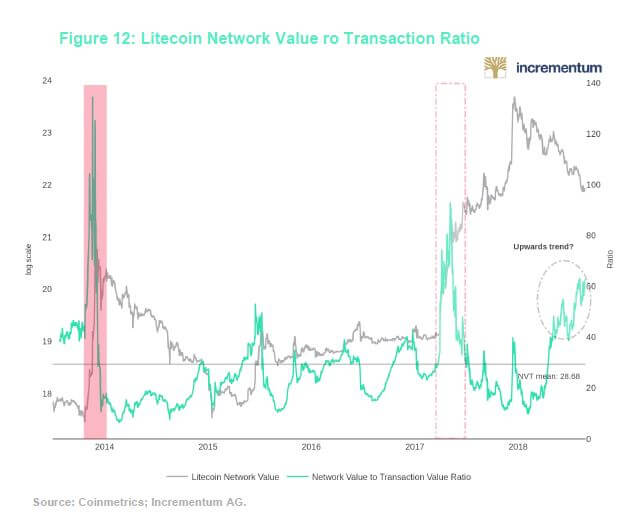
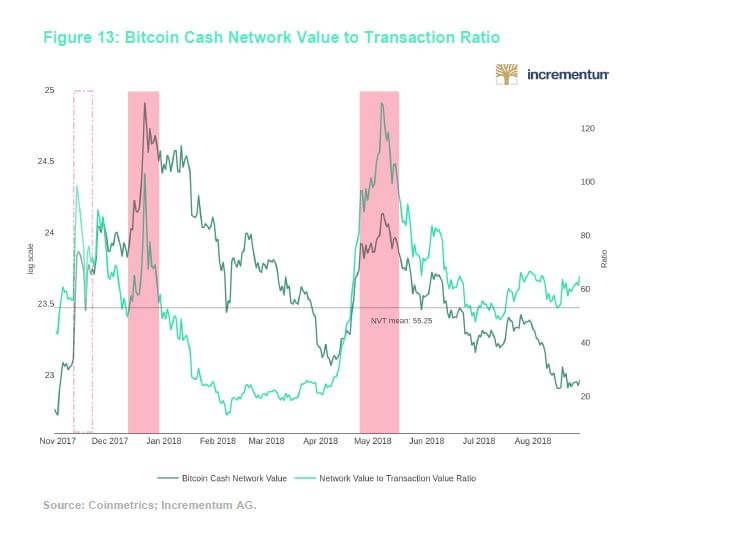
Similar to the NVM ratio, the NVT ratio of BTC and LTC are trading in the same range most of the time (20–60), while BCHs multiple is typically above 50 and at some points of its short history touching or overshooting the 100 mark, which might be indicative of an inherent overvaluation of BCH. As already discussed in the case of the NVM ratio, the NVT of LTC does not seem to have followed its historically predictive pattern during the most recent bubble in late 2017. Please refer to our possible explanations for this trend in the previous section.[8]
Network Value/Transaction Value to Growth
The previous two subchapters dealt with the NVM and NVT ratios in great detail, but as we can see from our analyses, the ratios sometimes suggest contradicting findings as far as over or undervaluation of a crypto asset is concerned. Both ratios are without doubt the most useful relative valuation ratios at the moment, however, researchers have noted that a metric combining their insights into one single figure would be desirable. NVT does not factor in the value-added to the network through new users, whereas NVM does not consider the total amount of economic activity that users actually expend on the network as opposed to just owning an address. This is why researchers[9] are drawing the connection between traditional finance and the crypto world by looking at the second most common relative metric used, namely the Price/Earnings to Growth ratio.

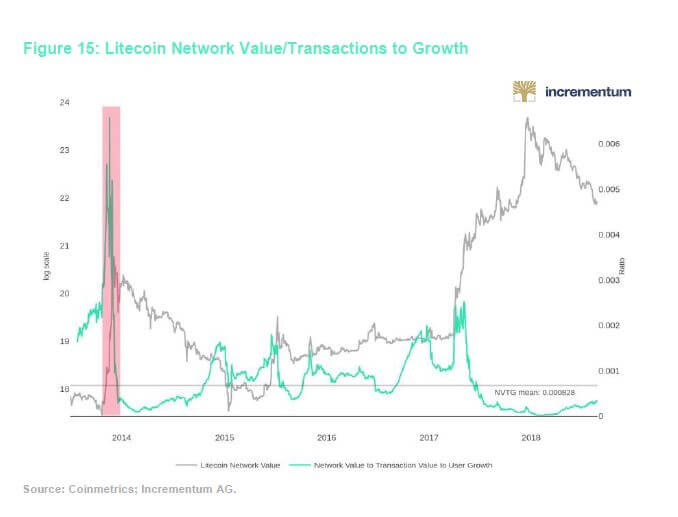
The PEG ratio is particularly useful in valuing stocks with high growth potential but close to non-existent earnings which would result in a very high P/E ratio and thus an incomplete assessment. If we apply the PEG ratio to crypto, we obtain the Network Value/Transactions to Growth (NVTG) ratio, which aims at factoring in both the economic throughput on a network and the growth of its user base in one single metric. Applying this concept to real networks we obtain the following results shown in Figures 14, 15, and 16.

The NVTG metric summarizes the findings we obtained from analyzing NVM and NVT for the three assets separately. Altogether, the ratios indicate room for further downwards correction towards their respective fundamental value as suggested by user numbers and transaction volumes for Bitcoin and Bitcoin Cash. As introduced earlier, Litecoin seems to have lost touch with its fundamentals completely, which is why its NVTG ratio appears to be of little predictive value at this stage.
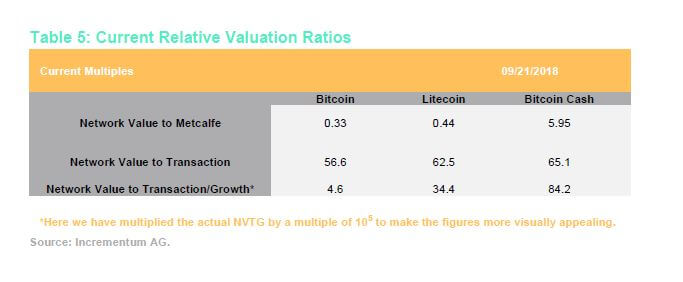
To wrap up, we have summarized the current state according to relative valuation in one table for the selected tokens. As evident, Bitcoin seems to have the healthiest valuation levels on a relative basis compared to its peers, albeit being quite elevated in an historical comparison. Bitcoin Cash has clearly the most exaggerated valuation multiples relative to its user base and transaction volume. We will continue to monitor these ratios very closely in the future and plan to provide regular updates on them.
[2] See “Metcalfe’s Law after 40 Years of Ethernet,” Bob Metcalfe, Computer, Vol. 46, No. 12, 2013.
[4] See “On Bitcoin Maximalism, and Currency and Platform Effects,” Vitalik Buterim, Ethereum Blog, November 19, 2014
[5] Here we are focusing on the relationship between the network value and an aggregate user metric, aiming at keeping the network effect as general as possible. It would require further research into discerning the individual effects at play to arrive at a complete fundamental measure.
[6] For internet companies with strong network effects, the analogous daily active usersDaily Active Users (DAU) indicator is one of the most important performance and valuation metrics.
[7] See “Introducing our adjusted transaction volume estimates,” Coinmetrics Team, Coin Metrics, June 27, 2018.
[8] See “Re-thinking Network Value to Transactions (NVT) Ratio,” Dmitry Kalichkin, February 4, 2018; “Debunking Market Narratives: Litecoin ($LTC) Edition,” Tushar Jain, Multicoin Capital, September 14, 2018.
[9] See “Improvements on the Network Value to Transactions (NVT) Ratio & Introducing Network Value/Transactions to Growth (NVTG) to Value Crypto,” Vikram Arun, Medium, March 29, 2018.


