
Understanding the true cost of trading Bitcoin in a fragmented and often opportunistic market can be complex. This article explores why prices vary significantly across different cryptocurrency marketplaces, including centralized exchanges (CEXs), liquidity providers (LPs), and decentralized exchanges (DEXs). It addresses the lack of an official consolidated best bid and offer (BBO) for crypto assets and how some market participants prioritize profit over best execution.
What Is the cost to trade Bitcoin & other crypto assets? The question sounds simple, but alas, it is not, with the vast majority of current markets ignoring other participants & trading at prices which are often higher or lower than other markets display. There are several reasons for this phenomenon:
- A perceived lack of data — there is no “official” consolidated best bid and offer (BBO) for crypto assets.
- Market Fragmentation — there are many marketplaces including centralized exchanges (CEXs), liquidity providers (LPs) and decentralized exchanges (DEXs) with conflicting price oracles.
- Opportunism — many market agents ignore “best execution” responsibilities to their clients in favor of maximizing profits from payment for order flow (PFOF) arrangements and keeping their costs down.
Our goal at CoinRoutes, in addition to helping investors navigate this market to achieve best execution, is to provide data to help investors & trading firms understand the market. We can provide context, despite the fragmentation, for understanding the cost of trading in terms that traditional institutional traders will be comfortable with. To that end, we have developed a consistent metric we call the CoinRoutes Liquidity Index. To understand why we constructed the index, however, it is useful to look at some raw data that shows trading costs across the major centralized crypto exchanges.
This chart shows the cost to buy and sell $25,000, $100,000, $250,000, $500,000 and $1,000,000 of Bitcoin in US Dollars from February through November of 2023:
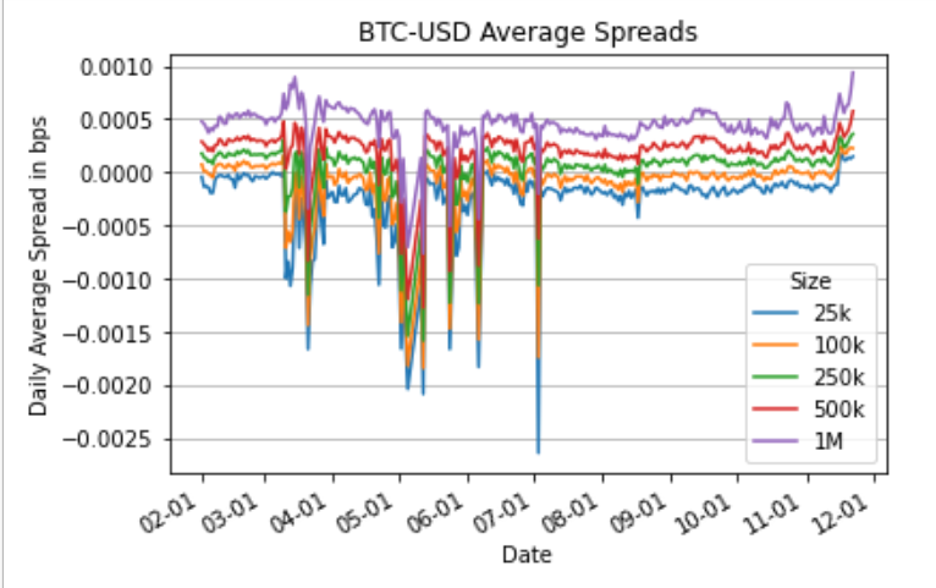
As can be seen in this chart, there is a small persistent negative cost for $25,000 orders that became very large during some of the periods earlier this year. The persistent negative cost results from price discrepancies across exchanges where the bid on one exchange is often higher than the offer. Traditional financial markets would call these “crossed markets” which are very rare in most asset classes, but almost always exist in digital assets. It is worth noting, however, that most of the time, those differences are lower than the costs to move assets between exchanges and arbitrage away the difference. There are, however, often meaningful differences during periods of high volatility. Such price discrepancies can create a distorted view of the potential cost to trade. As a result, we created the CoinRoutes liquidity index to normalize the data and provide traders with a consistent and fair benchmark for understanding the cost of liquidity.
To calculate the CoinRoutes Liquidity Index, we measured the cost differential between $25k orders and $1 million orders based on optimal “smart routing” for buying and selling at each size. This is calculated by “walking the book”, as CoinRoutes holds the full order book of all major exchanges in memory. The calculation uses that order book to add up the cost for selling at all bids, ranked in order of highest to lowest to achieve a $1 million sale and the cost of buying from all offers, ranked from the lowest to the highest to achieve a $1 million buy. We then calculated time weighted averages from 5 second samples every day. It is important to note that this benchmark assumes optimal order routing, meaning it assumes all exchanges were available for trading at all times, with sufficient inventory of dollars, stablecoins or tokens. As a practical matter, this requires access to sophisticated routing technology and superior treasury management. As a result, this is a difficult benchmark for most institutions to replicate without spending on infrastructure or paying a vendor. It is, however, an accurate and fair method to measure the cost of liquidity, before markups or fees that most liquidity providers may charge.
CoinRoutes Liquidity Index Results:
CoinRoutes calculated the index from February through the end of November of 2023 for Bitcoin & Ether denominated in US Dollars, in USDT (Tether) and for Perpetual Swaps for both also denominated in US Dollars and USDT. There are several important conclusions:
1) Costs for trading Bitcoin and Ethereum in institutional size are quite competitive with global equities of similar market capitalizations, if the institution is able to access all markets. (Retail investors in Bitcoin and Ethereum pay much more, which is quite different than equity markets where such traders pay extremely small spreads, often with no fees)
2) USDollar spot transactions are more expensive than USDT (Tether) spot trades. While this trend has moderated somewhat over the year, it is still statistically significant.
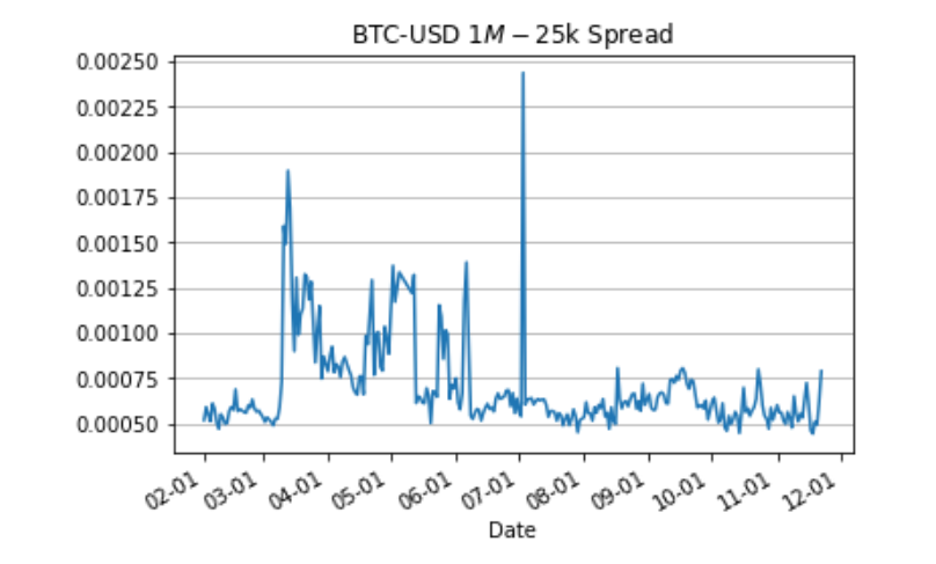
For Bitcoin, over the last quarter, the dollar cost for $1 million in liquidity averaged between 5 and 7.5 basis points, while the USDT cost for $1 million in liquidity averaged between 3.5 and 5.5 basis points with some more volatility.
For Ethereum, over the last quarter, the dollar cost for $1 million in liquidity averaged between 5 and 9 basis points, while the USDT cost for $1 million in liquidity averaged between 4 and 8 basis points.
3) There is more liquidity & lower cost to transact in perpetual swaps than in spot. This is unsurprising, as reported volumes on the swaps market are significantly larger than spot, but the order book data backs this up. This also explains why OTC trading is so popular in the spot market, as the market makers are able to hedge in the perpetual swaps market to create tight spreads.
For Bitcoin, the perpetual swap cost for $1 million in liquidity averaged between 3.5 and 7 basis points for the USD denominated swaps and between 1 and 2.5 basis points for the USDT denominated swaps.
For Ethereum, the perpetual swap cost for $1 million in liquidity averaged between 4 and 8 basis points for the USD denominated swaps and between 2 and 3.5 basis points for the USDT denominated swaps.
This first chart show the liquidity cost to buy or sell $1million of Bitcoin in US dollars across the major crypto exchanges. Note that during the spring and again in the early summer there were spikes, predominantly on weekends when banking issues made moving money across exchanges difficult, but the average has settled into a range between 5 and 7.5 basis points. As this measures the cost for each, it implies an average bid / offer spread of between 10 and 15 basis points for US dollar based liquidity, which is similar to what anecdotal evidence suggests is an average spread for institutional size.
In conclusion, navigating the fragmented cryptocurrency market to achieve best execution is fraught with challenges, from varying prices across exchanges to opportunistic behaviors by market participants. This article has highlighted the complexities and the persistent price discrepancies that can distort the perceived cost of trading.
The CoinRoutes Liquidity Index emerges as a crucial tool, offering a standardized benchmark that helps traders understand the real cost of liquidity. While achieving optimal order routing and superior treasury management may be difficult without significant investment, the index provides a fair and accurate method to measure trading costs, paving the way for more informed and effective trading strategies in the digital asset space.